Dashboard
The dashboard is TechWatchAlert’s home page. It gathers what deserves your attention in cards called widgets: the CVEs that affect the project’s stack, their severity, whether they are exploited, the components to update, remediation deadlines, how far the team’s handling has got, and the CERT-FR advisories that concern you.
- Who it is for: any project member. Everyone has their own dashboard: what you add, remove or move does not change your colleagues’ dashboards. The data shown, however, is the project’s, shared by the team (alerts, cases, stack); only the alerts’ read state is yours.
- Where: menu Overview › Dashboard (it is also the page you land on after signing in).
- Scope: project widgets read the active project, chosen at the top of the sidebar (Active project). Switching project changes their content, not the layout of the dashboard.
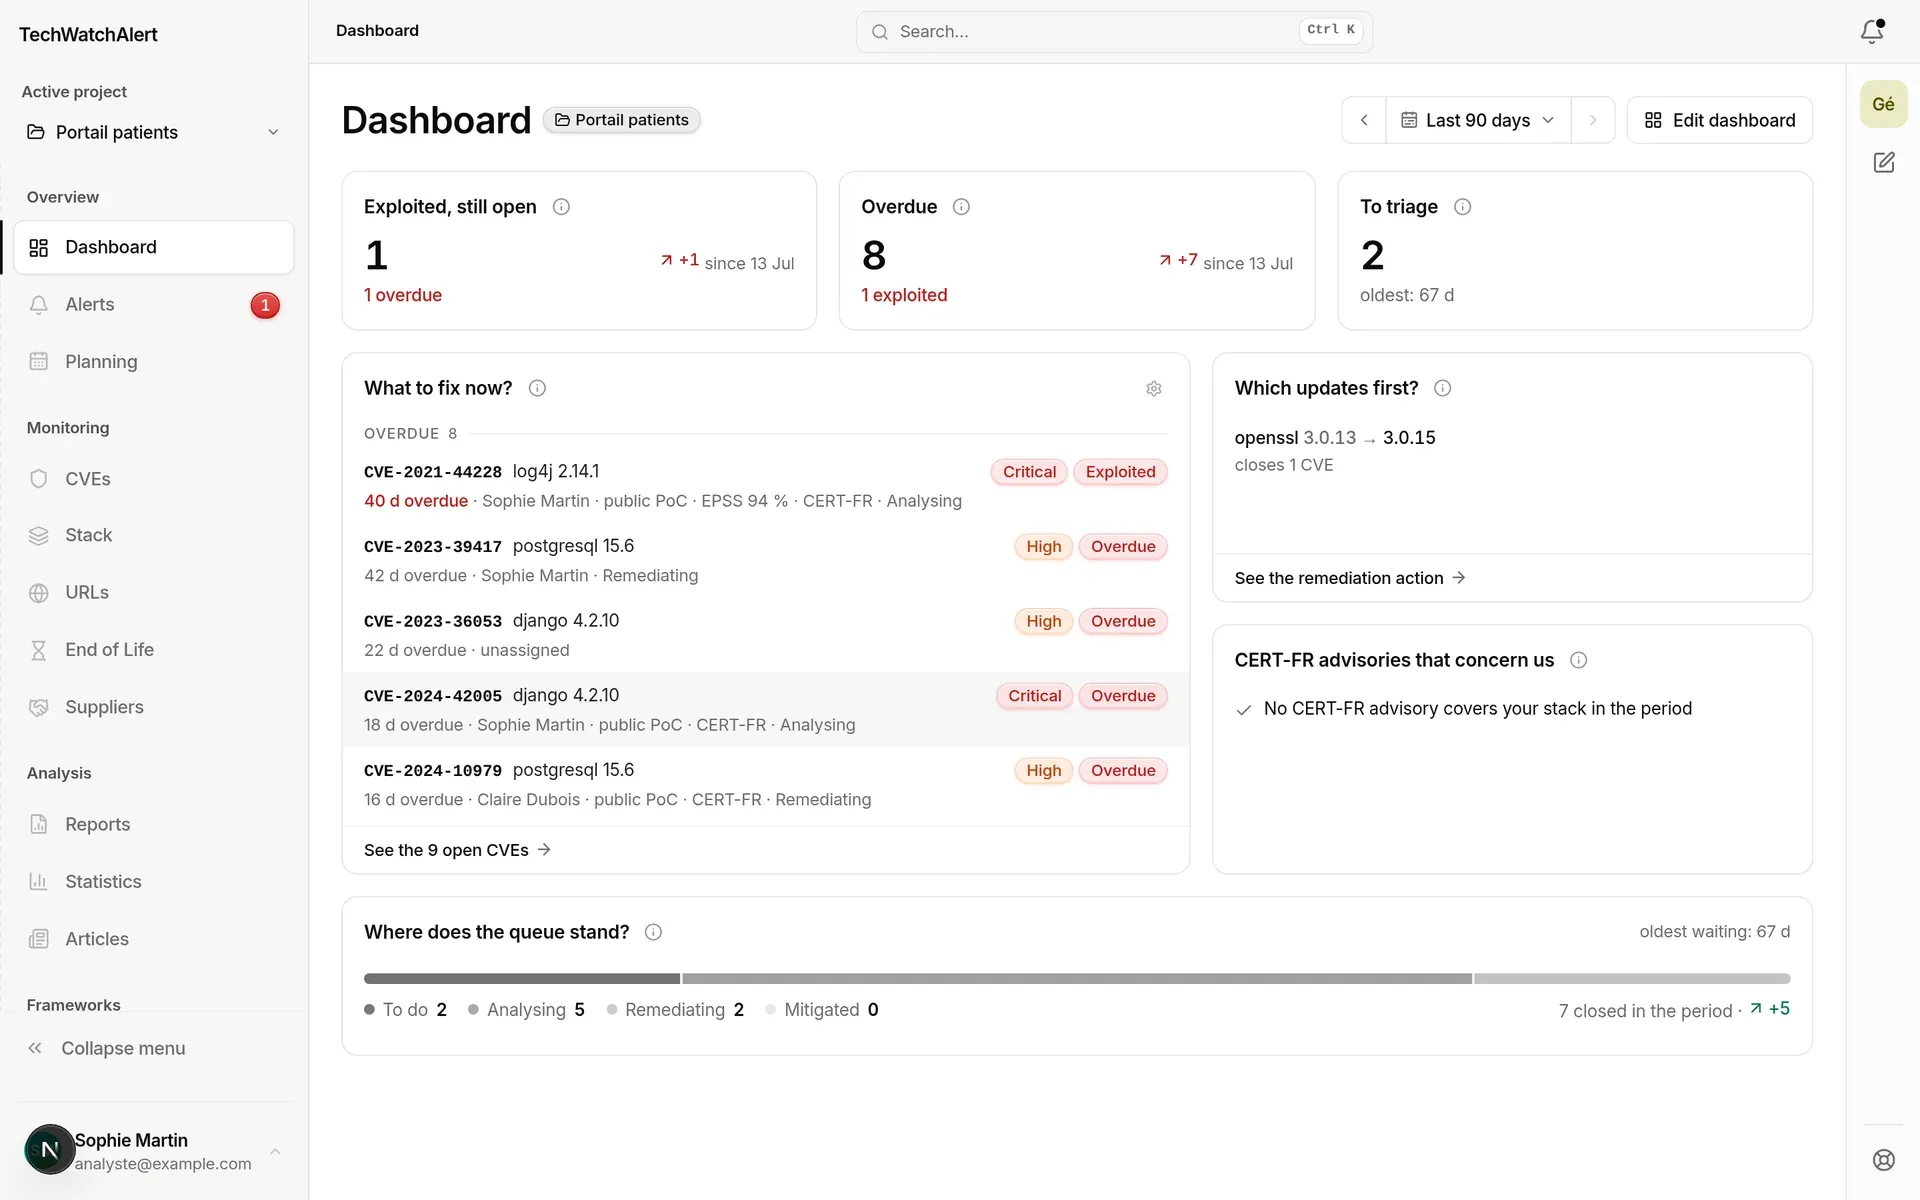
- Title and active project: the pill shows the project whose data the widgets display (here “Portail patients”).
- Period: the time window applied to every widget that has a notion of time, with its ◀ ▶ arrows (see The period).
- Edit dashboard: opens edit mode to add, remove, move or resize widgets (see Building your dashboard).
- Counters: exploited CVEs still open, CVEs past their remediation deadline, CVEs to triage. The whole card links to the filtered list whose total equals the figure.
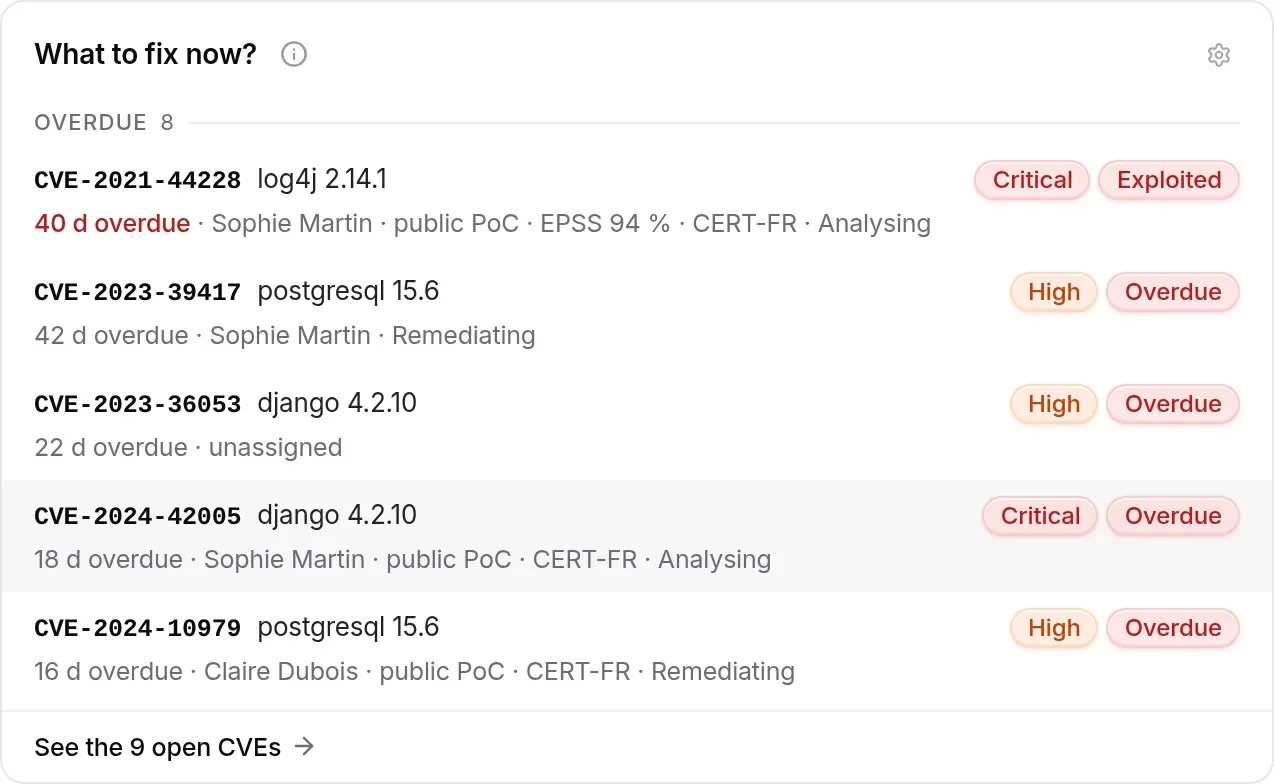
- What to fix now?: the work queue, overdue first.
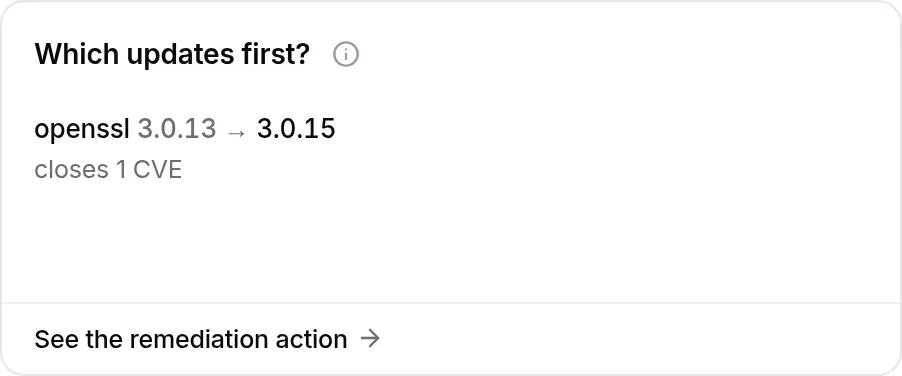
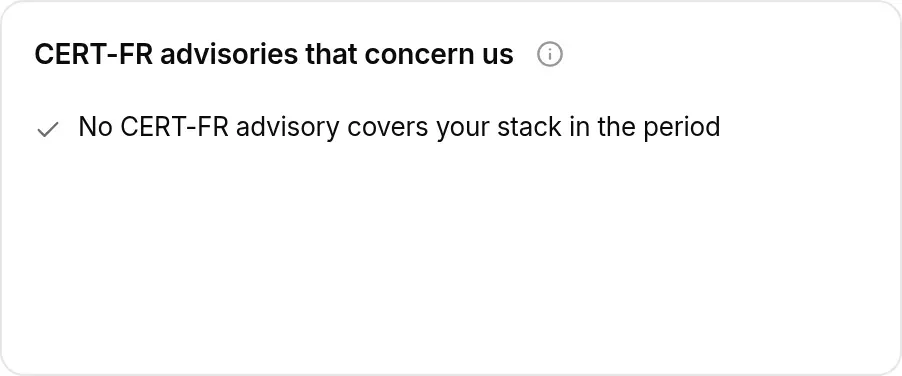
- Which updates first? and CERT-FR advisories that concern us: the two shortcuts that empty the queue fastest.
- Where does the queue stand?: open cases by status.
Every card has an ⓘ: a click says how the figure is calculated. Colour is kept for what calls for action (red: exploited, overdue, late) and for severity; everything else is grey.
A dashboard for your role
Section titled “A dashboard for your role”TechWatchAlert builds your starting dashboard from your role, without asking:
- Analyst, “What to fix today?” (above): for whoever handles the alerts, including an owner alone in their organisation.
- CISO and management, “Are we meeting our commitments?”: for the person holding the CISO or management function, and for the owner or an administrator of an organisation with several members. The period summary (with a comment you can write), exploited open CVEs, the share of deadlines met, time to fix, “Are we gaining ground?”, the most exposed projects and compliance actions.
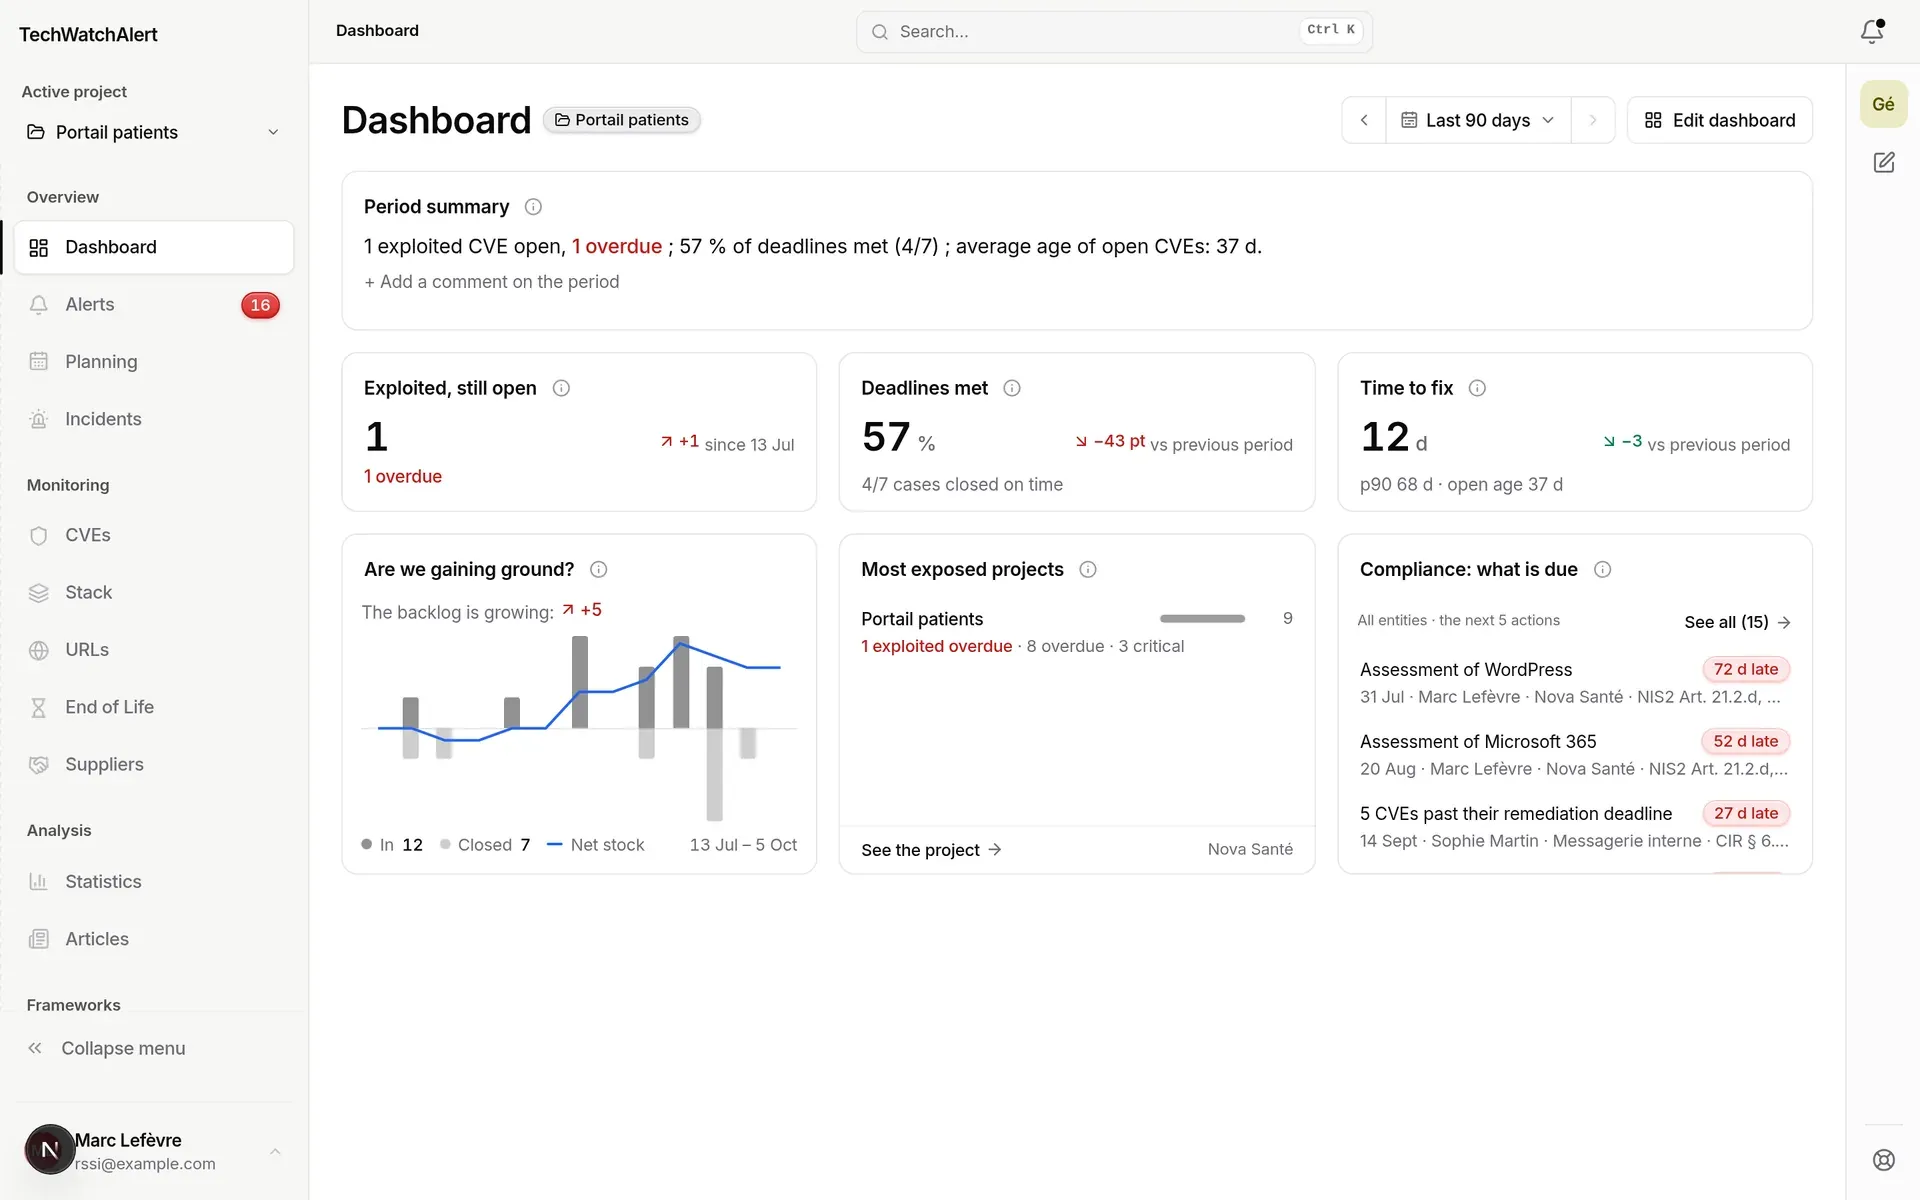
Cards adapt to your plan: without case management, “Overdue” gives way to ends of life within 30 days and “Where does the queue stand?” to stack coverage, rather than showing “Not included”. On the partner side, the Partner space page answers “Which clients should we call?” (see Partner space).
If your dashboard changed
Section titled “If your dashboard changed”In October 2026 the default dashboards were simplified. A dashboard you had never touched received your role’s layout; a banner says so, with Go back to the previous one (your previous layout is kept) and Got it.

A dashboard you had customised was left alone: the banner offers the new dashboard (Switch to the new dashboard, or Keep mine). Your old counters were converted: “Critical CVEs” became “Exploited, still open”, “High CVEs” “Overdue”, and “Unread alerts”, “Medium CVEs” and “Watched items” “To triage”.
The period
Section titled “The period”A single period applies to the whole dashboard: there is no per-widget time setting.
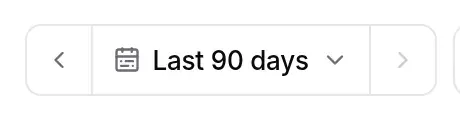
Click the displayed period to open the menu:
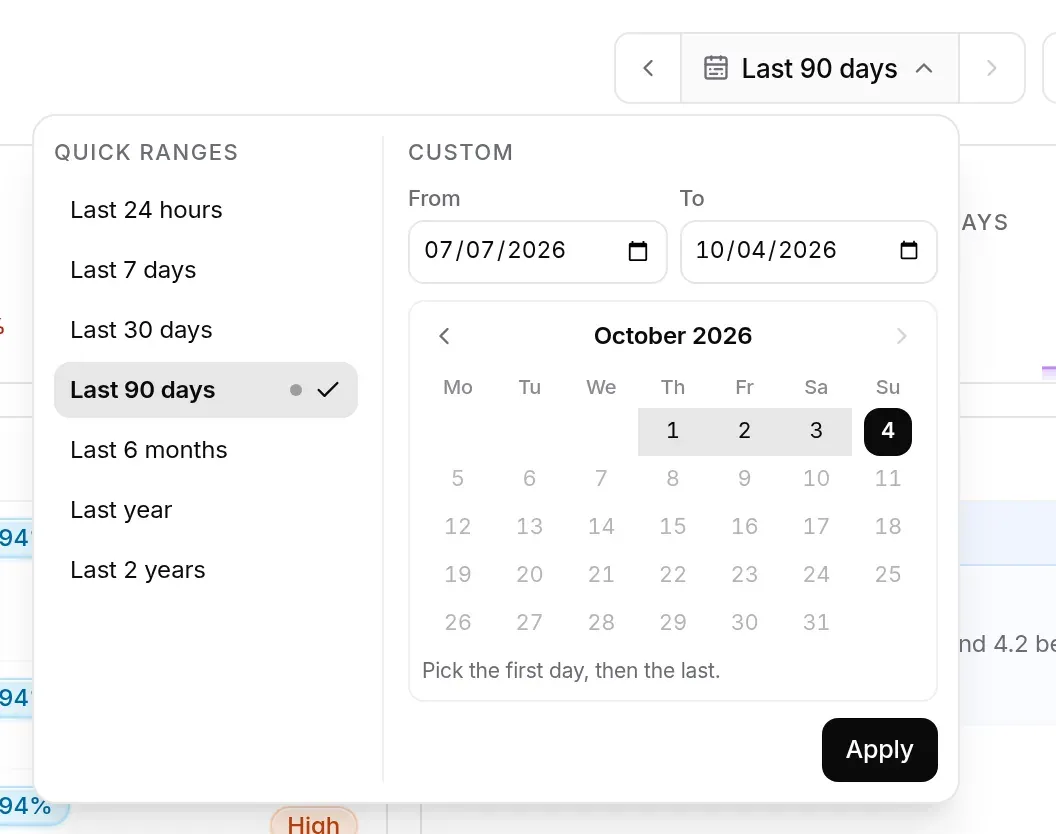
- Quick ranges: Last 24 hours, Last 7 days, Last 30 days, Last 90 days, Last 6 months, Last year, Last 2 years. The selected range has a tick; a small grey dot marks the dashboard’s default period.
- Custom: enter the From and To dates, or click the first then the last day in the calendar, then Apply.
Rules applied:
- a range spans 1 to 731 days (two years); the end date can be neither before the start date nor in the future. Error messages say so under the fields;
- “Last 6 months” counts 182 days, “Last year” 365 days, “Last 2 years” 730 days;
- custom-range dates are whole days, from 00:00 to 23:59 (UTC).
The arrows ◀ ▶ shift the window by one period length, into the past or back towards today. Shifting a relative period turns it into a date range: after clicking ◀ from “Last 90 days”, the selector shows the range of the previous 90 days. The ▶ arrow is greyed out while the period ends today.
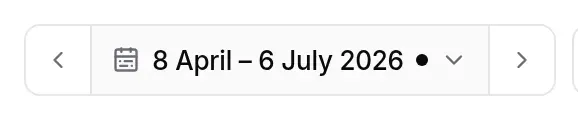
When the displayed period is not the default, a dot appears next to its label, and the menu offers Back to the default period.
What the period changes
Section titled “What the period changes”- Follow the period: Unread (alerts raised over the period), CERT-FR advisories that concern us (advisories published over the period), the counters’ change (compared with the start of the period), the period summary and its comment, the closures in “Where does the queue stand?” and the time-based metrics (Time to fix, Where does it get stuck?, First response, Deadlines met, Are we gaining ground?).
- Do not follow the period: widgets describing a current state: counter values, What to fix now?, Getting started, End of life and certificates, Open exposure, Backlog age, Which updates first?, Most exposed projects, stack coverage, Remediation deadlines, Who holds what?, Compliance: what is due. Their definition (ⓘ) says so.
- Comparison: a state counter compares with the same state at the start of the period (“+1 since 13 Jul”); a delay or a share compares with the previous period of the same length. Under twenty units the change is written as a number (“+5”, never “+250%”); a share changes in points. Green when the change is desirable, red otherwise; nothing when there is no reference.
A dashboard’s default period is “Last 90 days”. To change it, see Setting the default period.
The widgets
Section titled “The widgets”Widgets fall into five families, those of the add catalogue. Unless stated otherwise, a widget reads the active project. The catalogue was narrowed on 4 October 2026 to what serves a team that manages vulnerabilities: if a card has disappeared from your dashboard, it no longer exists (see Retired widgets).
Overview
Section titled “Overview”-
Counter: a figure that calls for action, chosen in the settings: Exploited, still open (exploited CVEs whose case is open or not created yet), Overdue (remediation deadline passed or escalated; needs case management), To triage (alerts whose case is pending or does not exist yet, with how long the oldest has waited), End of life within 30 days, Age of open CVEs (mean and median). The line below states the action (“1 overdue”, in red); at zero it says all is calm and when it was calculated. A click opens the matching filtered list.
-
Period summary: a calculated status line (exploited open CVEs, deadlines met, age of open CVEs) and a comment on the period, which any member who can edit the dashboard writes with Add a comment on the period; it is signed, dated and specific to each period.

-
Most exposed projects: the organisation’s projects ranked by overdue exploited, exploited, overdue, then critical CVEs. A click selects the project.
-
Can we trust our alerts? (stack coverage): recognised components out of the total, those without a version and those with no match in the CVE data, and the date of the last inventory review. A badly described component raises no alert.
-
Open exposure: the project’s distinct unclosed CVEs, how many are actively exploited, their split by severity, and the exploitations expected within 30 days (sum of EPSS probabilities).
-
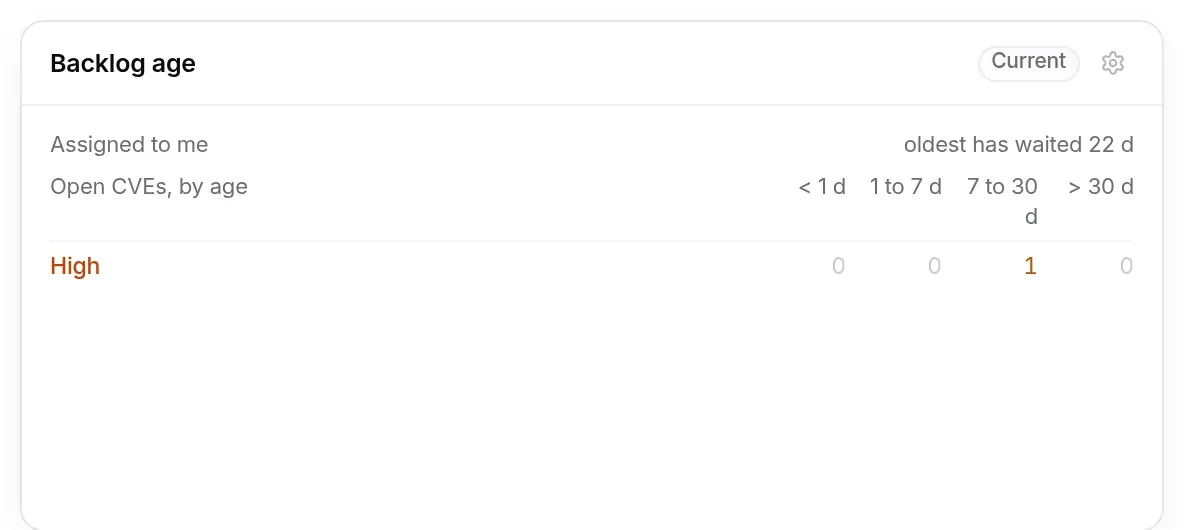
Backlog age: open CVEs by age (under a day, 1 to 7 days, 7 to 30 days, over 30 days) and by severity.
-
Which updates first?: the version upgrades that close the most open CVEs, exploited ones first: the component, its installed version, the target version and what it closes. A click opens the “actions” view of the alerts.
CVEs and alerts
Section titled “CVEs and alerts”- What to fix now?: the project’s work queue, in groups: overdue, then exploited, then due soon, then the rest; within each group, exploited and most severe first. Each line shows the CVE, the component, at most two pills (severity, then Exploited or Overdue) and a grey line: days overdue or left, owner, PoC, EPSS, CERT-FR and status. A click opens the project’s alert record. 5 lines by default, 1 to 20 in the settings; KEV catalogue only keeps only CVEs in CISA’s KEV catalogue.
- Unread: the project’s alerts you have not read (setting “Include alerts already read” to see them all). The tick button on a line marks it as read.
- CERT-FR advisories that concern us: CERT-FR advisories and alerts published in the period that cover at least one CVE that raised an alert in the project, with the number of CVEs covered and how many are still open. A CERT-FR alert reporting exploitation carries the Alert pill. A click opens the publication on the CERT-FR site.
Project
Section titled “Project”-
Where does the queue stand?: the project’s open cases by status (to do, analysing, remediating, mitigated) on a grey bar, each status linking to the filtered Alerts page; on the right, cases closed in the period and how long the oldest has waited. “To do” also counts alerts nobody has opened yet, like the To triage counter.

-
End of life and certificates: certificates of monitored URLs and followed ends of life, by date, with the countdown in days or “overdue”.
Remediation metrics
Section titled “Remediation metrics”Seven metrics measure how the active project’s cases are handled. They need a plan that includes case management (see Permissions and plan). Under their title, a line says what the figure covers: Team (all the project’s cases, shared by the team) or Assigned to me (only the cases whose CVE is assigned to you, see Assigning the case). The scope is chosen for each metric with its cog (see Configuring a widget); by default it is Team. Load per person, which already splits cases between assignees, and Remediation deadlines have no scope. Open exposure, Backlog age, Components to update and CERT-FR advisories on the stack accept the scope too.
In short:
- Remediation deadlines: open CVEs whose remediation deadline is escalated, overdue or due soon, the most overdue first (“D+5”: five days late; “D-3”: three days left), with the severity, the Exploited pill and the owner. The deadline is the one on the Due dates page. Its content also feeds “What to fix now?” and the “Overdue” counter.
- Time to fix: from detection to closure, the median in days, “9 cases out of 10” (p90) and the average age of what is still open; taller, the card breaks it down by severity and gives the closure reasons (fixed, accepted, ruled out): a falling delay because everything is ruled out is not progress.
- Where does it get stuck?: time spent in each stage.
- First response: the wait between detection and the first status change.
- Deadlines met: the share of cases closed in the period within the time the remediation policy sets for their severity, with its denominator (“4/7 cases closed on time”); the change against the previous period is in points.
- Are we gaining ground?: cases opened (bars up) and closed (bars down) per week, and the net backlog line: the backlog grows, shrinks or holds steady.
- Who holds what?: cases in progress assigned to each person, and the oldest.
NIS2 compliance
Section titled “NIS2 compliance”- Upcoming compliance actions: what the NIS2 registers expect from the active project’s organisation, in one list: late actions first (the oldest at the top), then the nearest due date, then what was just completed. At full width, a table: Control (the action and its detail), Framework (the article of NIS2 or of the implementing regulation, then the requirements of the frameworks the organisation follows, ISO 27001 for instance), Entity (the project, or the organisation for an organisation register), Owner, Due and Status. In a narrower card the Framework column moves under the title; in a narrow card and on a phone, actions stack. At the top, “All entities · the next 5 actions” and See all, with the total count, which opens the Planning, where all these deadlines line up on a timeline. A click on an action opens its page.
| Action | Register | Late | In progress | Completed |
|---|---|---|---|---|
| Inventory review, one per project | Inventory reviews | review overdue | due today | review recorded |
| Supplier assessment | Suppliers | assessment overdue | due within 30 days, or vital supplier never assessed | assessment recorded |
| Early warning (24 h), notification (72 h), final report (1 month) | Incidents | deadline passed, counted in hours under a day | early warning and notification while their clock runs, incident to assess | report recorded as submitted |
| Accepted risks review | Accepted risks | review date passed | review date within 30 days, or renewal requested | renewal approved |
| CVE fixes, one line per project and state | Due dates | fixes overdue or escalated | fixes due soon | — |
“Upcoming”: everything else, up to 90 days ahead. “Completed”: done in the last 14 days. Every due date is the register’s own, computed as on its page. The owner is the one the register names: the CISO for reviews and suppliers, the incident contact (failing that, the CISO), the requester of a risk acceptance, the CVE owner; for a completed action, the person who did it when the register knows. “—” when nobody is named.
Settings: the number of actions (5 by default, up to 20), the scope (Whole organisation or Active project) and Show recently completed actions. The card describes a current state and does not follow the period. It shows what you can read in the NIS2 space: the projects whose registers you read, and incidents only if you have access to them (see Who can see and do what).
Retired widgets
Section titled “Retired widgets”On 4 October 2026, twelve widgets left the catalogue because they did not relate to the project’s stack, repeated a page without adding anything, or duplicated another card: CVE reference feed, Severity distribution, CVE activity, Articles Feed, Projects, Tags, Latest Reports, Activity by member, Closure reasons, Reopen rate, Exploited share and Expected exploitation. Their content remains available elsewhere: the CVE database, Statistics, Articles, Projects and Reports pages; closure reasons are in Handling time, the exploited share and expected exploitation in Open exposure; activity by member and the reopen rate remain in the report.
On saved dashboards, a retired card was replaced by the one that carries its information when there was room (for example Severity distribution by Open exposure), otherwise removed; a dashboard nobody had touched took the new starting layout.
Getting started
Section titled “Getting started”The Getting started card helps a new account along: three steps (describe what you run, choose who receives the alerts, ask Vigie for a dashboard, the last only when the assistant is turned on), with a “n of 3” (or “of 2”) progress count. It disappears on its own at the project’s first alert. It is covered in First steps.

Configuring a widget
Section titled “Configuring a widget”Four widgets have their own settings: Counter (the metric), Unread, What to fix now? and Compliance: what is due; the widgets with a scope (the remediation metrics but Who holds what? and Remediation deadlines, plus Open exposure, Backlog age and CERT-FR advisories that concern us) add one setting, the scope. Their cog appears when you hover over the card (always visible on a phone).
- Hover over the widget, then click the Configure widget cog.
- Change the options offered.
- Click Save (or press Enter). Cancel or Esc closes the window without changing anything.
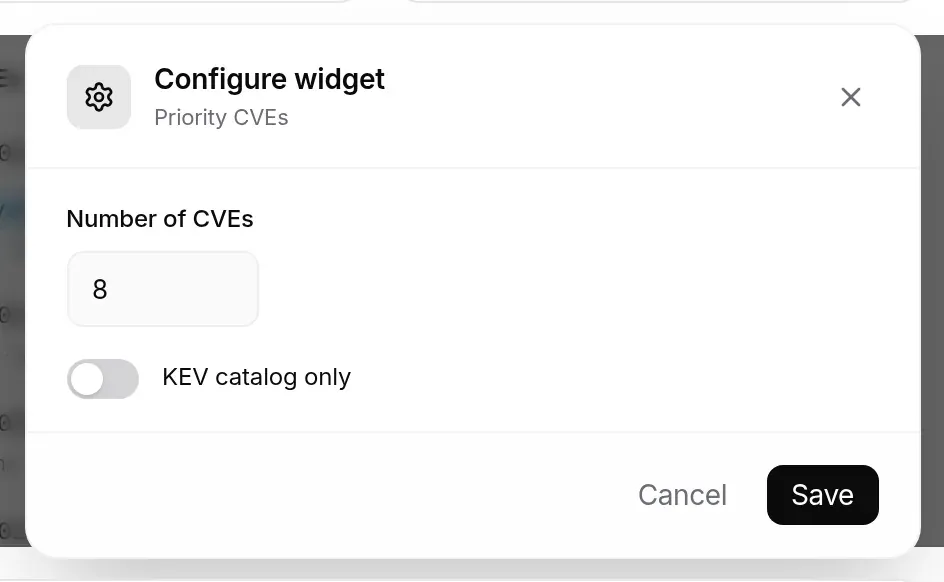
The setting is saved straight away for that widget on your dashboard.
A metric’s scope
Section titled “A metric’s scope”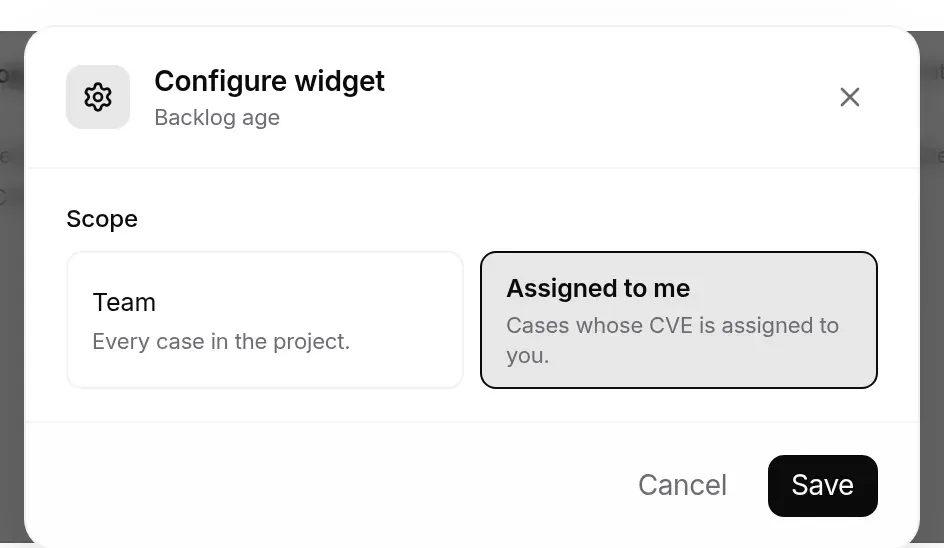
- Team: every case in the project.
- Assigned to me: the cases whose CVE is assigned to you in the active project. A CVE nobody has assigned to you does not count, even if you handled it.
The scope is a setting of your dashboard: add the same metric twice, one with the Team scope and one with Assigned to me, to compare them. When an assignment changes, the metrics update.
Building your dashboard
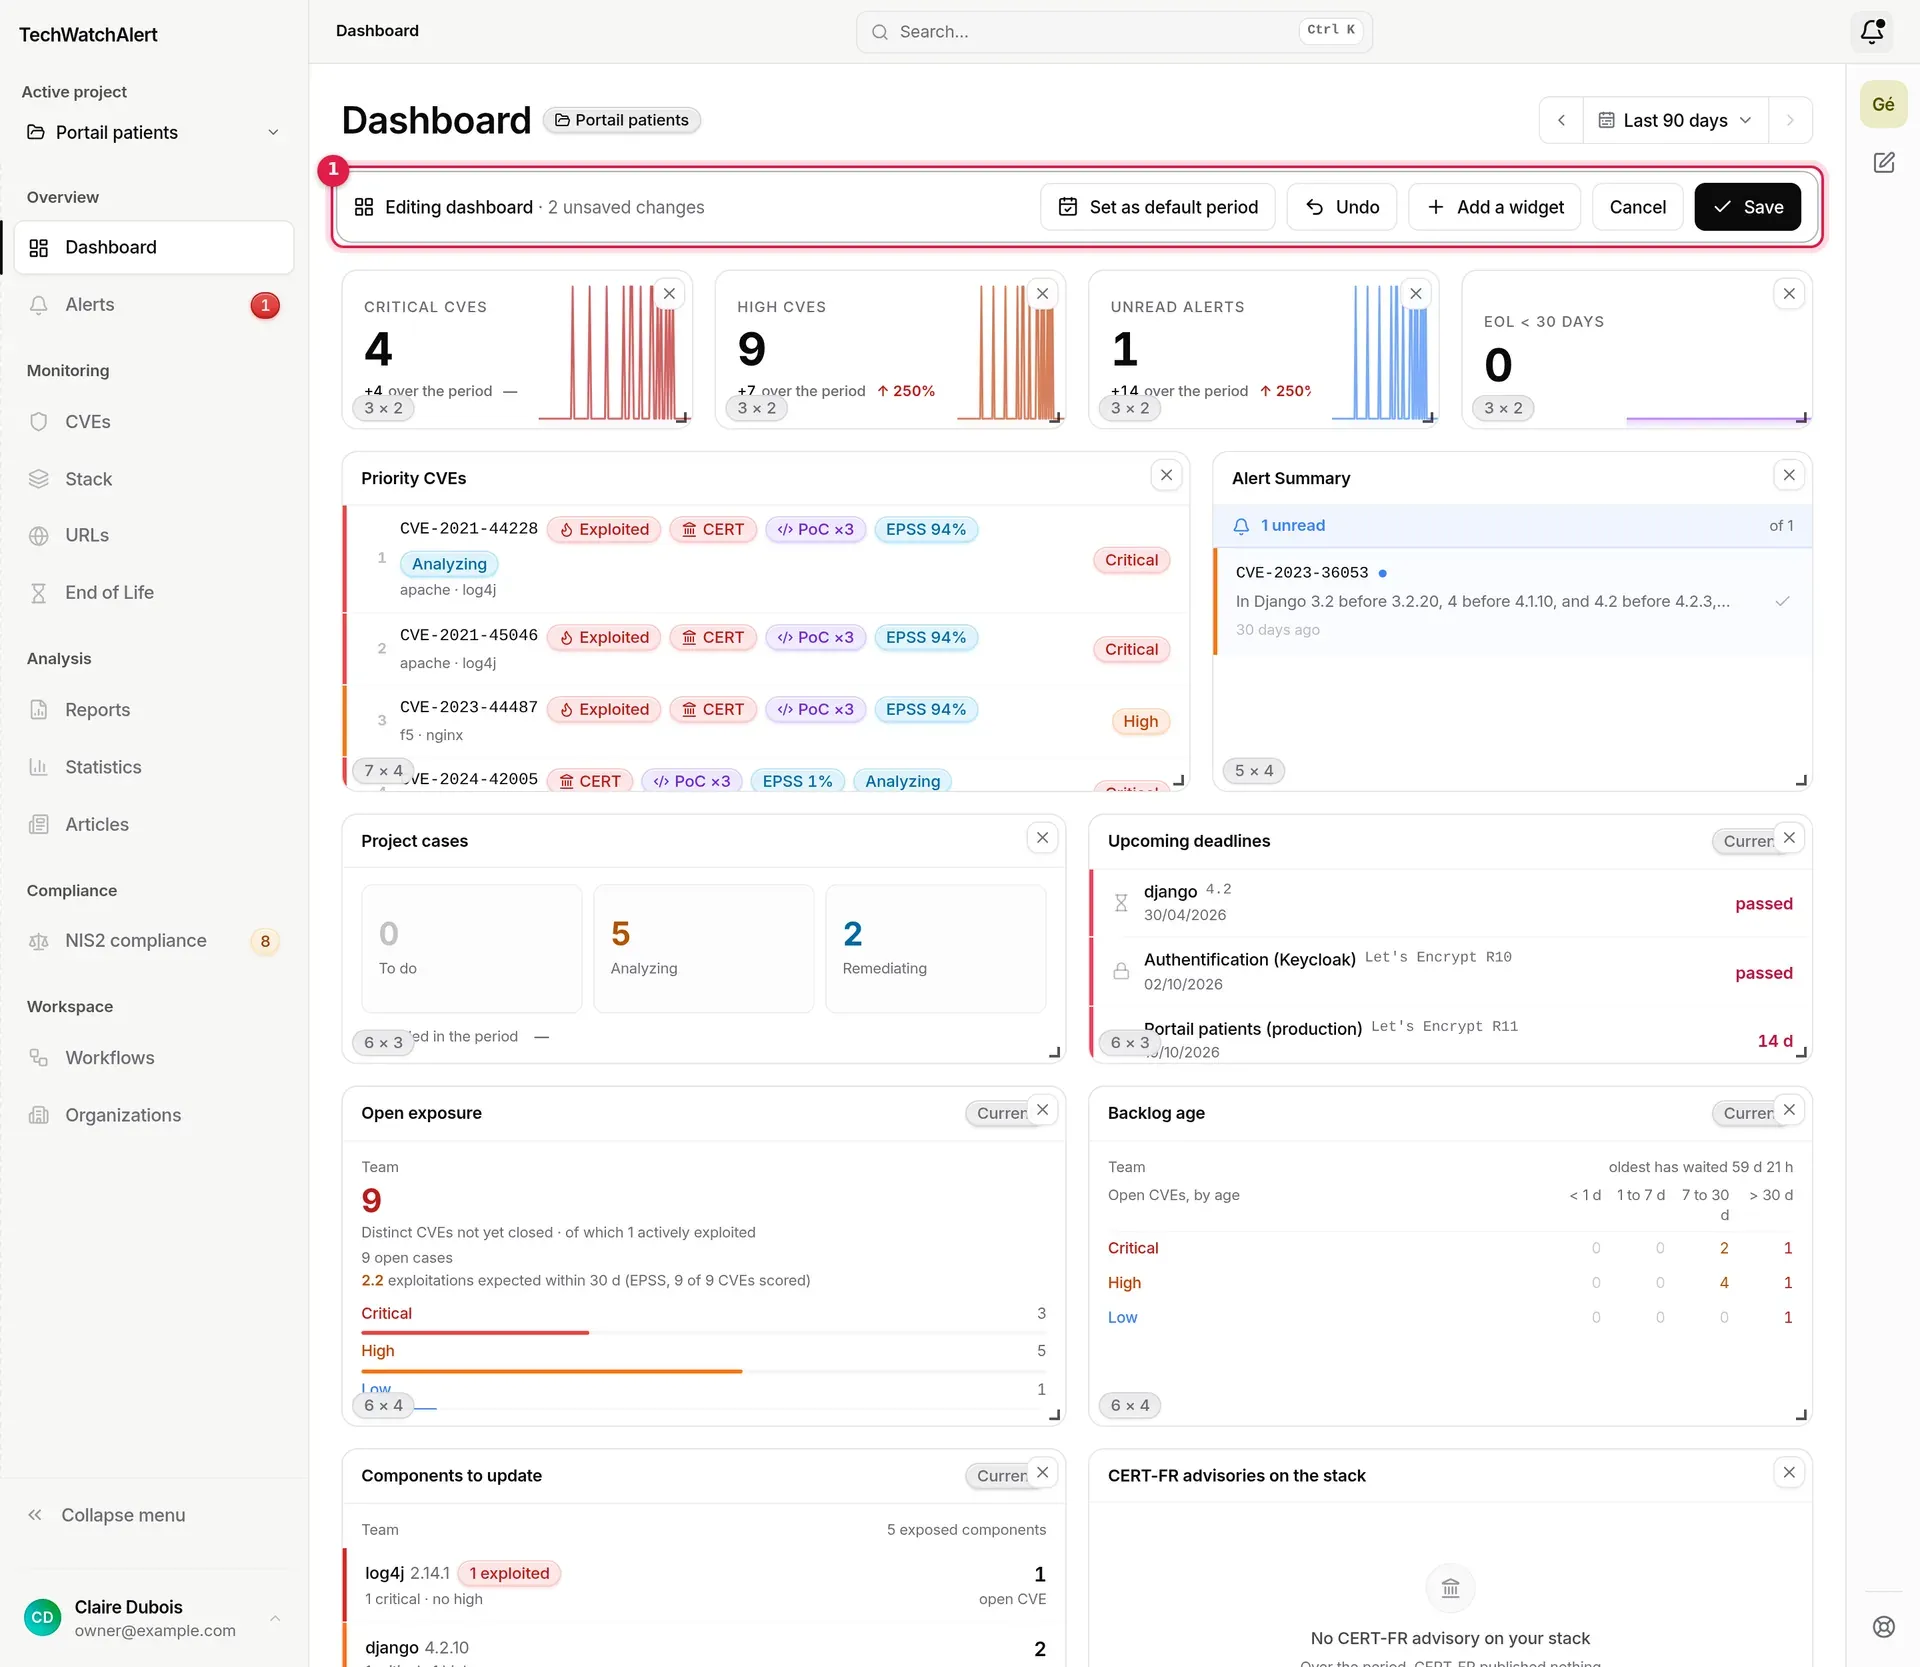
Section titled “Building your dashboard”Edit dashboard opens edit mode. Nothing is saved until you click Save: you can experiment freely, then cancel.
In the edit bar, Default dashboard puts a role’s layout (Analyst or CISO and management) in as a draft: you see it on the grid, then save or cancel it. It is the way to start again from a clean dashboard.
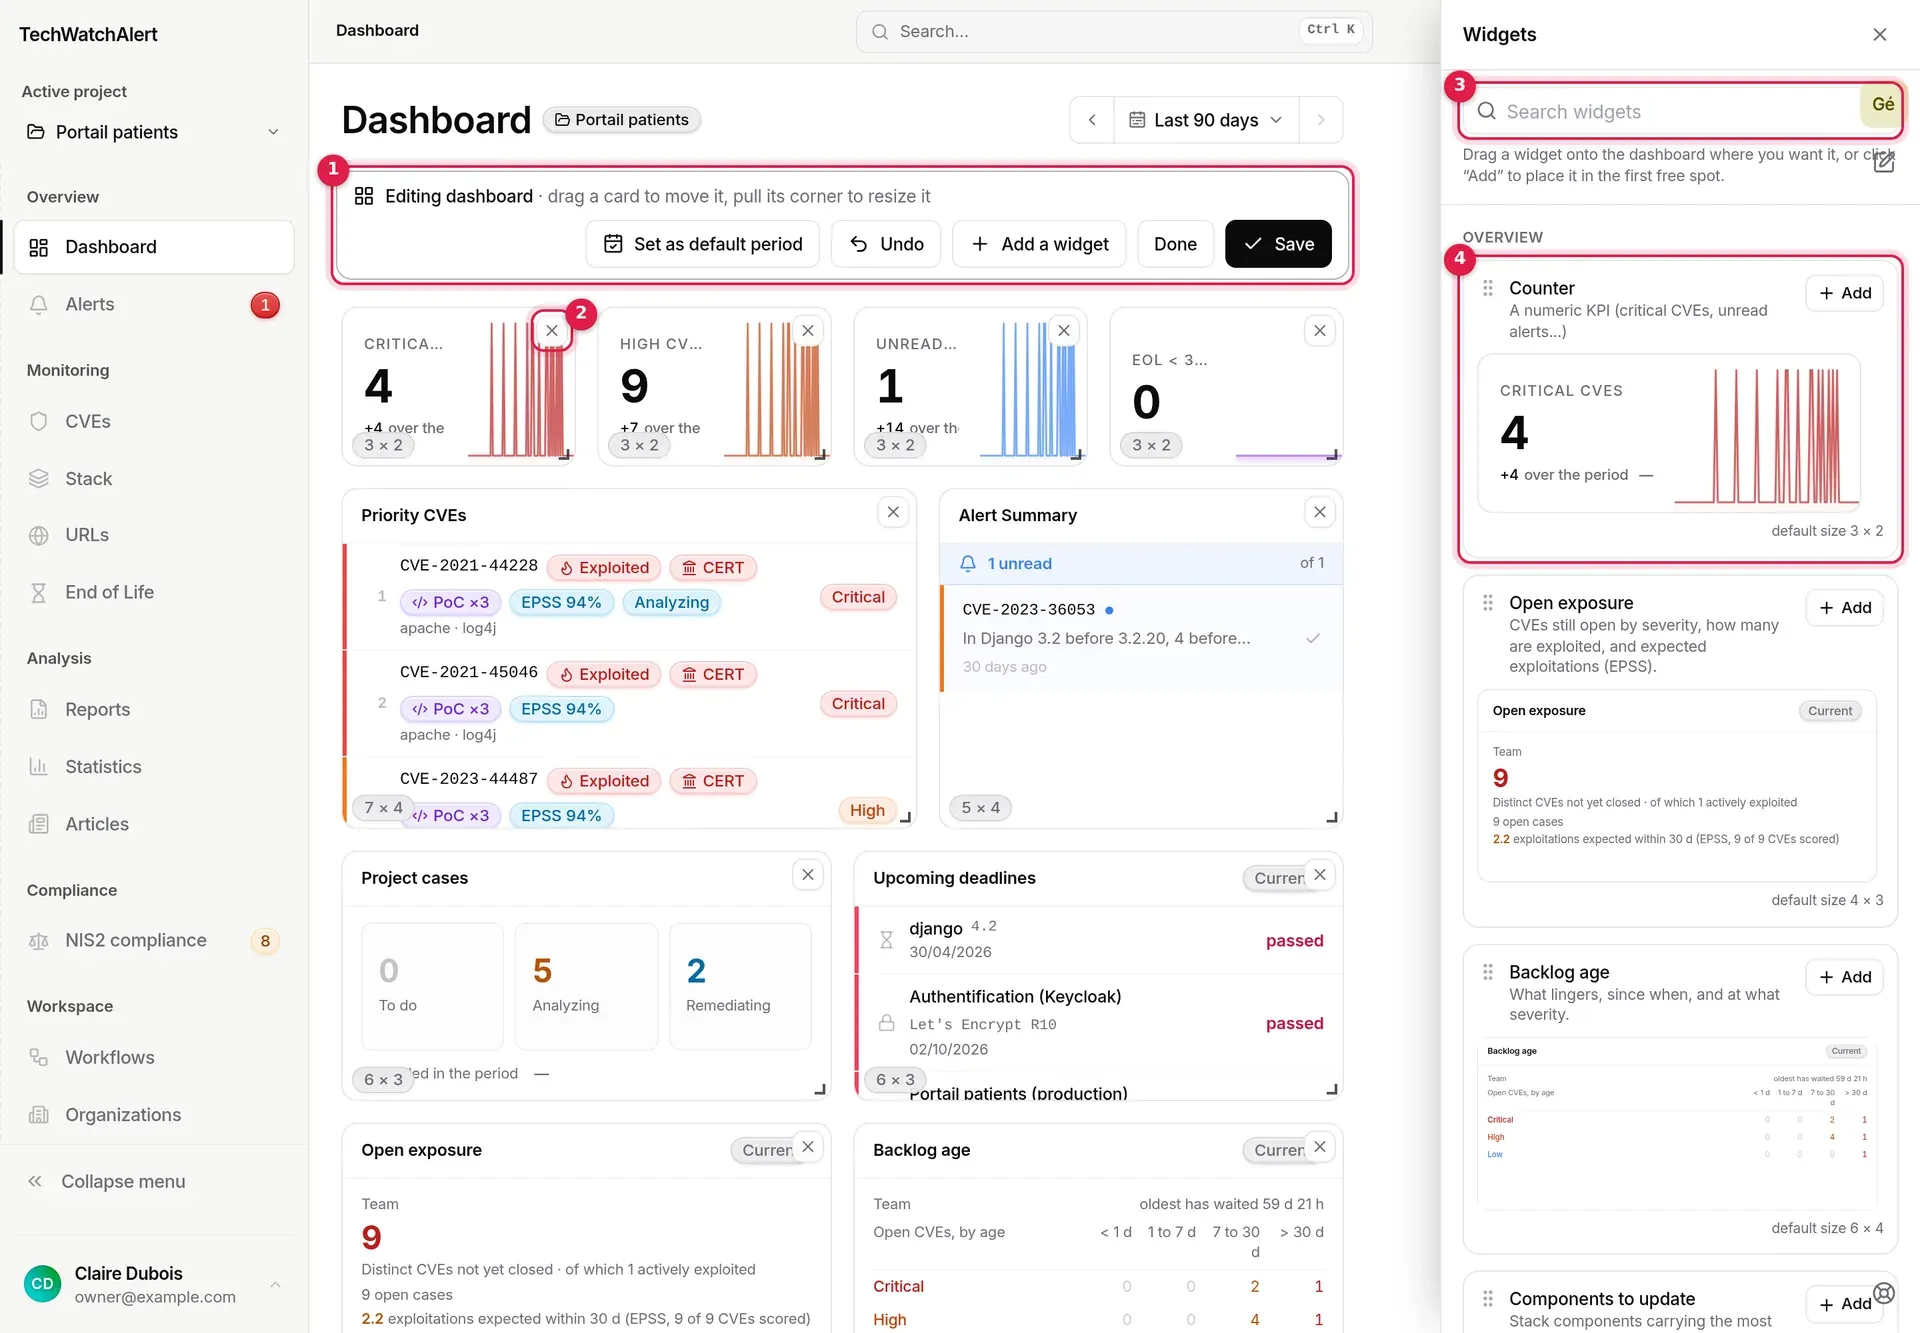
- The edit bar: the current state (“drag a card to move it, pull its corner to resize it”, or the number of unsaved changes) and the mode’s commands.
- Remove: the cross in each card’s corner removes it from the dashboard. Under the card, its size in columns × rows.
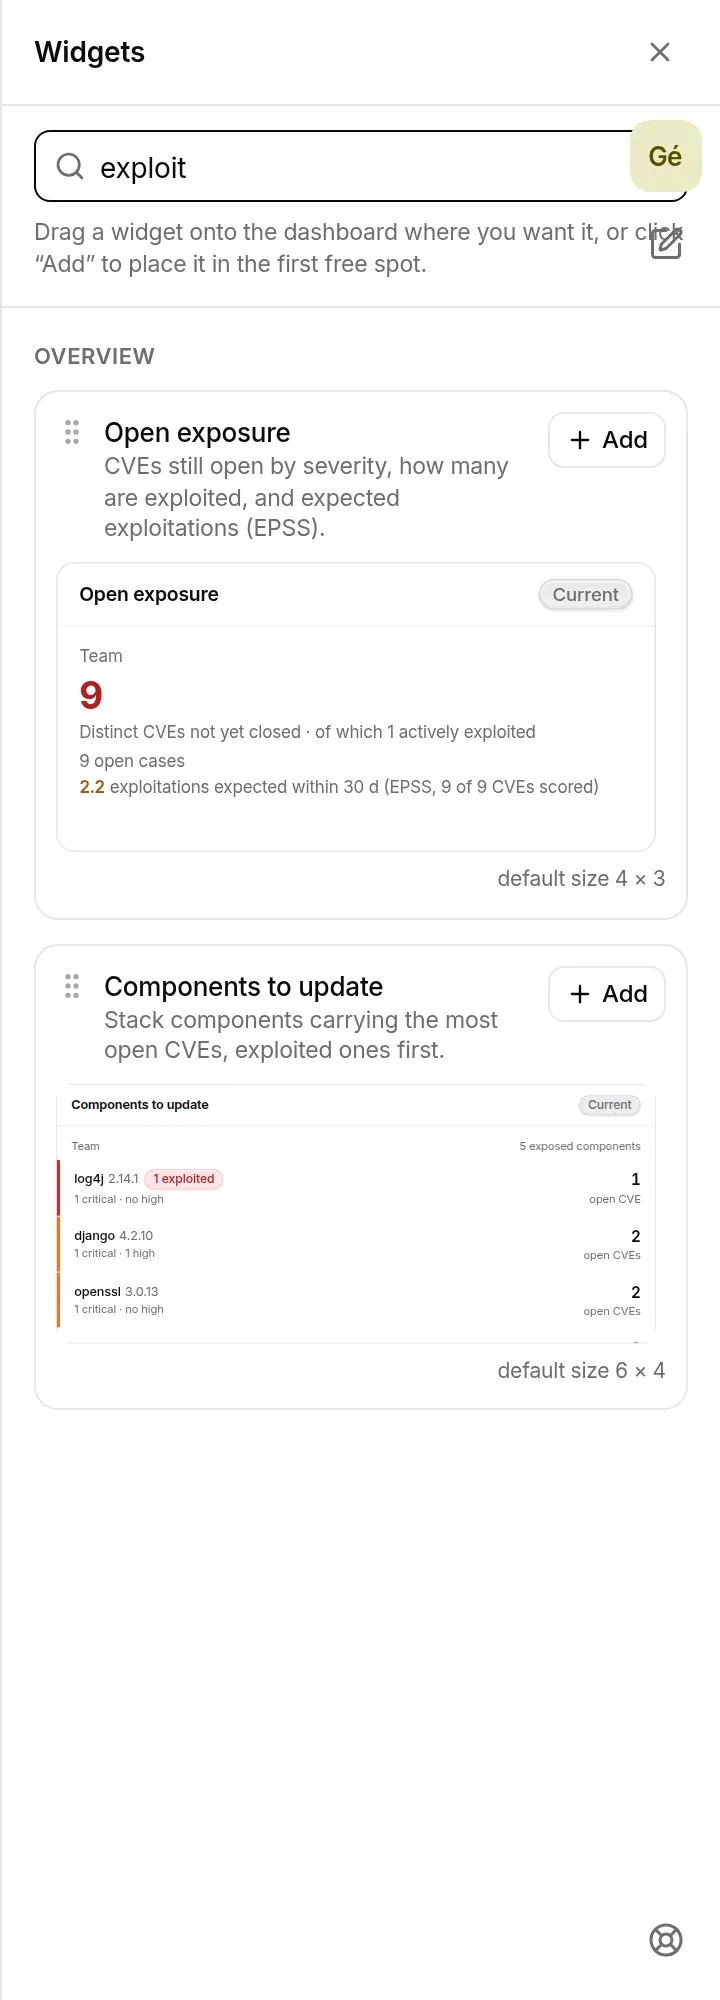
- Search widgets in the panel (by name and description, ignoring accents).
- A catalogue entry: name, description, a live preview of the widget with your data, default size and an Add button.

Adding, moving, resizing and removing
Section titled “Adding, moving, resizing and removing”- Click Edit dashboard, then Add a widget to open the Widgets panel.
- Add a widget: Add places it in the first free spot; you can also drag the panel entry to where you want it on the dashboard.
- Move a card by dragging it: the others make room. Resize it by pulling its bottom-right corner.
- Remove a card with its cross.
- Undo reverses the last action.
- Click Save. Cancel discards all changes; when nothing has changed, the button reads Done.

Grid rules:
- the dashboard is a twelve-column grid; each widget only accepts the widths at which it stays readable (the catalogue gives its default size, for example “default size 7 × 4”);
- the resize handle stops at the widget’s useful height: two to three rows for a number, six for a chart, eight for a list;
- Tidy up puts the cards back at their intended sizes, in aligned rows with no gaps, in the current reading order (numbers grouped on one row, lists and charts side by side at the same height); like every gesture in this mode, it can be undone and is only saved with Save;
- a dashboard holds at most 60 cards: beyond that, the panel says “The dashboard has reached 60 cards: remove one to add another.”;
- overlapping cards or an out-of-range size prevent saving, with a message in the bar;
- the same widget can be placed several times (two counters on two metrics, for instance);
- leaving the page with unsaved changes triggers the browser’s warning.
Setting the default period
Section titled “Setting the default period”- Choose the period you want with the selector (a quick range or a custom range).
- Click Edit dashboard, then Set as default period. The button then reads “Default period: label”.
- Click Save.
The dashboard will now open on that period. If the displayed period is already the default, the button is greyed out.
Asking Vigie for a dashboard
Section titled “Asking Vigie for a dashboard”Tell Vigie what the dashboard is for rather than which widgets to place: “a dashboard for my management”, “a dashboard to track exploited vulnerabilities”, “add the CERT-FR advisories”. Vigie picks the widgets that answer the question, starting from the dashboard for your role (analyst or CISO and management), and explains why in one sentence.
The layout is not left to the assistant: TechWatchAlert arranges the widgets itself, at the sizes intended for each one. Numbers are aligned on one row, lists and charts go in twos or threes at the same height, the work queue can carry two stacked cards beside it, and nothing stretches alone across the full width unless it is designed to. When Vigie adds, removes or moves a widget, the whole dashboard is arranged the same way.
A dashboard holds seven widgets: beyond that, Vigie keeps the ones most useful to your request, tells you which it left out and offers a swap. Adding an eighth widget through Vigie is refused with the reason “seven cards at most per dashboard: remove a card first”. In edit mode you stay in control and can always add widgets yourself.
One dashboard per person
Section titled “One dashboard per person”The interface shows one dashboard per person: the one marked as default, otherwise the first. TechWatchAlert creates it with the account, with the Getting started card; at the first alert it takes your role’s layout (see A dashboard for your role). There is no dashboard list and no button to create a second one in the interface; the same dashboard serves all your projects, and the active project changes its content.
Permissions and plan
Section titled “Permissions and plan”- Every member sees and builds their own dashboard; no particular permission is needed.
- Each widget respects your permissions: without access to cases, “Where does the queue stand?” and the metrics show “Case access not allowed”. Remediation metrics, Remediation deadlines included, need a plan that includes case management (Team, Pro or Business); otherwise they show “Not included in your plan”. The counters (except Overdue), What to fix now?, Open exposure, Backlog age, Which updates first?, CERT-FR advisories, Most exposed projects and stack coverage are included in every plan.
- Project widgets show “Select a project” while no project is active.
- Upcoming compliance actions needs a plan that includes NIS2 (Pro or Business), otherwise it shows “Not included in your plan”; at least one project of the organisation must also be enabled, otherwise it shows “No project covered by your frameworks” with an Open frameworks link (see Turning NIS2 on for a project). An organisation member sees at least the supplier assessments; the other actions follow their permissions in the NIS2 space.
Frequently asked questions
Section titled “Frequently asked questions”My dashboard changed on its own. It had never been touched: it received your role’s layout (see If your dashboard changed). Go back to the previous one, in the banner, restores your previous layout.
“Overdue” is not clickable. The alert list can filter on the deadline only for a project that tracks its remediation deadlines; elsewhere the figure is still right, but the card does not lead to a list that would not match it.
A widget has disappeared from my dashboard. It is one of the widgets retired from the catalogue (see Retired widgets). When there was room, it was replaced by the widget that carries its information; otherwise the grid closed up. For your CVEs by severity, use Open exposure; for figures across the whole reference feed, the Statistics page.
What is the difference between “End of life and certificates” and “Remediation deadlines”? End of life and certificates is about certificates and ends of life; Remediation deadlines, about the time allowed to fix open CVEs, per the project’s policy.
Why does Upcoming compliance actions not list my CVEs one by one? It groups them by project and state (“3 CVEs past their remediation deadline”) so that reviews, assessments and incident reports stay visible next to them. The CVE-by-CVE detail is in Remediation deadlines and on the Due dates page, which a click on the line opens.
I changed the period and my colleague does not see the same thing. The displayed period only changes your screen (and the page address). Send them the link, or save it as the default period of your dashboard.
I removed a widget by mistake. Until you save, Undo or Cancel brings it back. After saving, add it again from the Widgets panel; its settings have to be set again.