Imports, connectors and scans
Typing a stack item by item works for a handful of products. For a real inventory, TechWatchAlert reads what you already have: an SBOM or a dependency manifest, the technologies a URL serves, the GLPI or Intune inventory. And an imported vulnerability scan shows what is actually installed, against what is declared.
| You have… | Where | What it does |
|---|---|---|
A CycloneDX SBOM or a manifest (package.json, requirements.txt…) |
Monitoring › Stack › Import a file | Offers each component for addition, with its version. |
| A site in production | Monitoring › Stack › Detect from a URL | Offers the detected technologies, with vendor and version when identifiable. |
| GLPI or Microsoft Intune | Project settings › Inventory | Keeps the stack up to date every night, including removals. |
| A Trivy, Grype or CycloneDX report with vulnerabilities, or a network scanner export (Nessus, Greenbone/OpenVAS, Qualys, Rapid7 InsightVM) | Project settings › Scans, or the API from CI | Checks the CVEs found against the project’s tracking records, host by host for a network scanner. Does not fill the stack. |
Importing an SBOM or a manifest
Section titled “Importing an SBOM or a manifest”The Import a file button on the Stack page opens the Import an inventory window. Nothing is added before you confirm: the file is analysed first, then you choose the components.
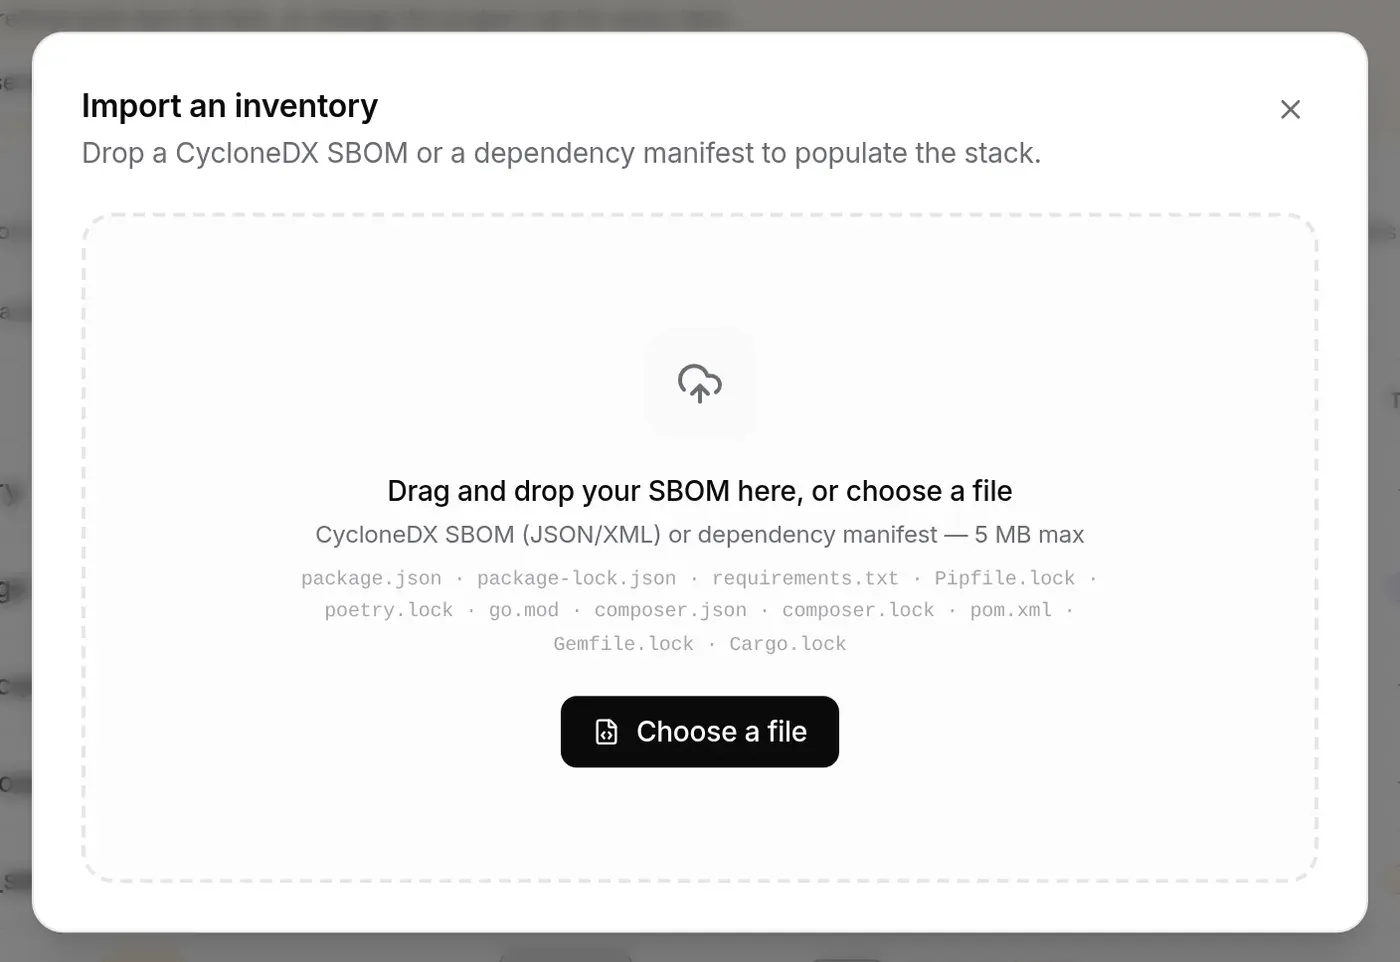
Accepted formats (5 MB max, 5,000 components max):
- CycloneDX SBOM, JSON or XML;
- dependency manifests, recognised by their file name:
package.json,package-lock.json,requirements.txt,Pipfile.lock,poetry.lock,go.mod,composer.json,composer.lock,pom.xml,Gemfile.lock,Cargo.lock.
Any other file name is read as a CycloneDX SBOM. The SPDX format is not supported: export your SBOM as CycloneDX.
-
Click Import a file, then drag the file onto the area or click Choose a file. Parsing is shown (“Parsing file…”).
-
The review screen lists every component in the file.
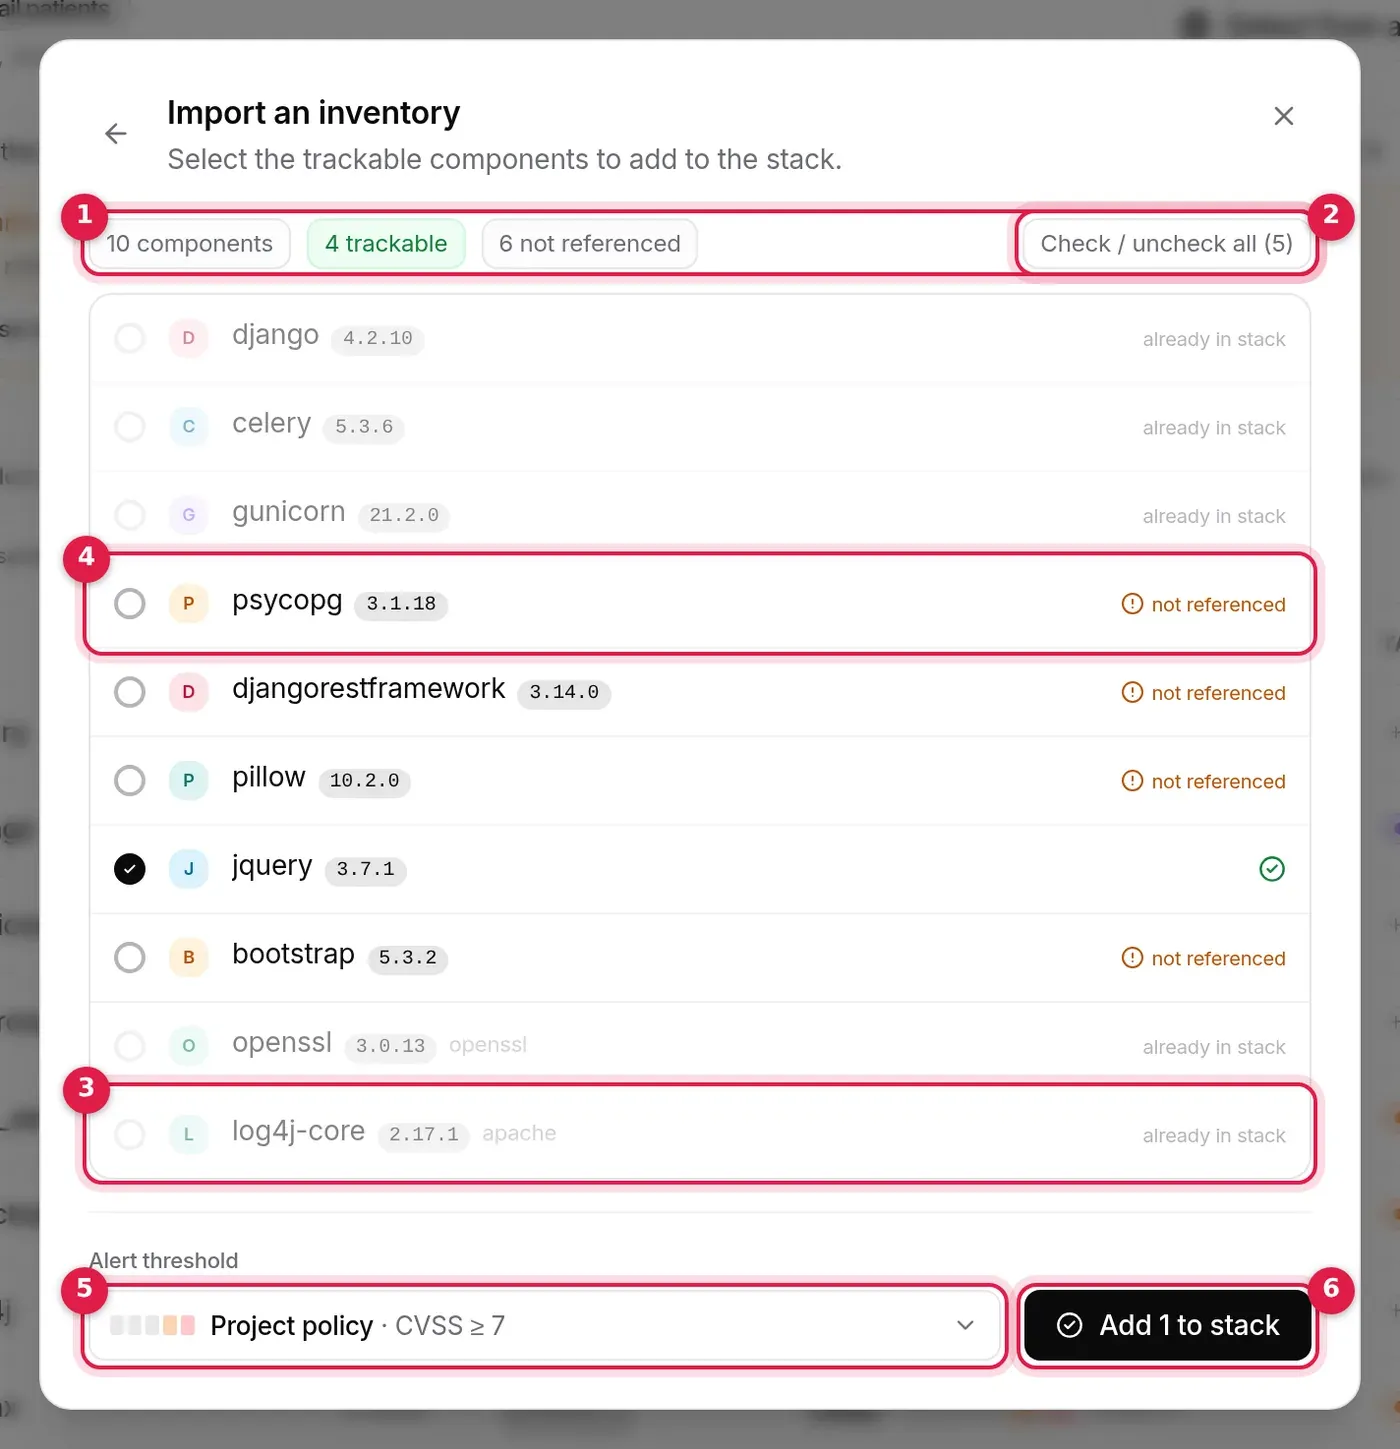
- Summary: number of components, how many are trackable (already named by a CVE) and not referenced.
- Check / uncheck all: acts on every selectable component.
- A component already in stack is greyed out and cannot be ticked.
- A not referenced component (no CVE names it yet) is unticked but can be ticked.
- Alert threshold: one threshold for the whole import, the project policy by default.
- Add N to stack: adds the ticked components.
-
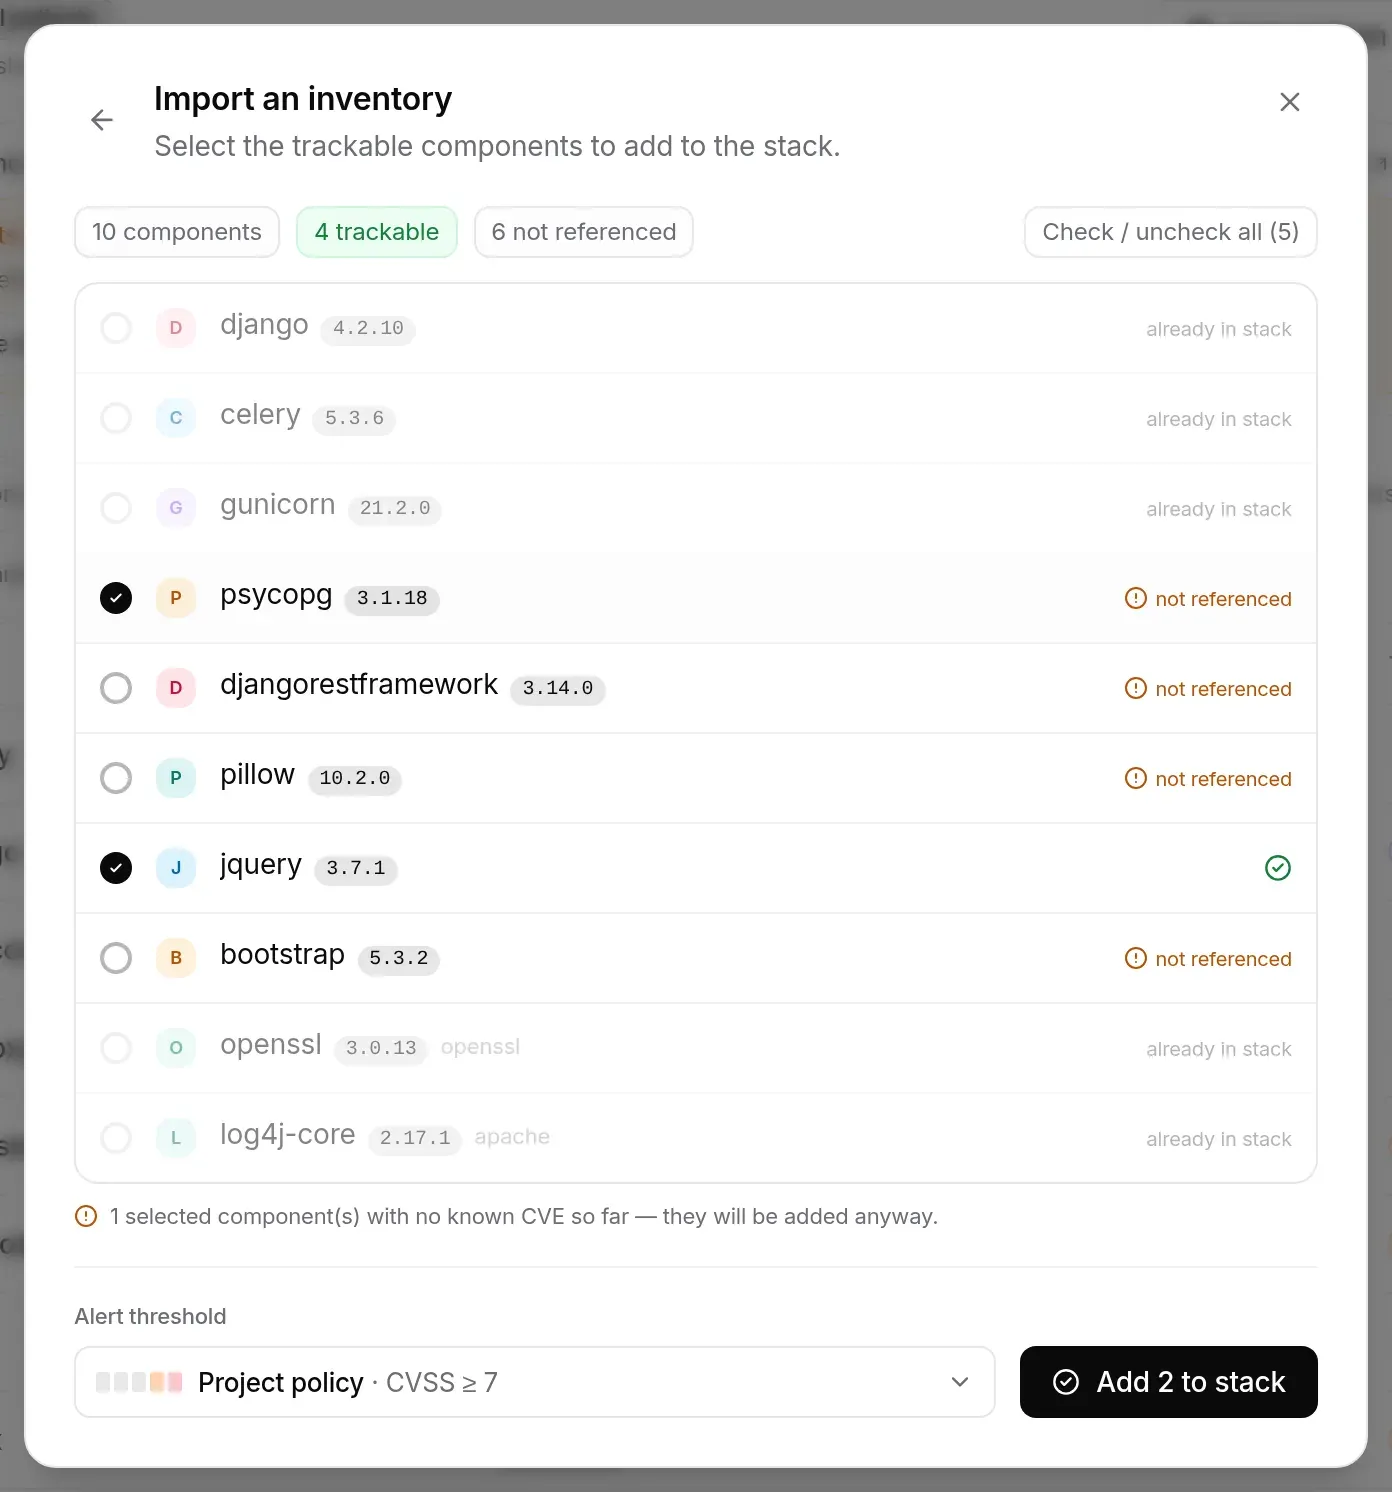
Check the selection. At first, trackable components not already in the stack are ticked. Ticking a not-referenced component is allowed: a warning reminds you, and it is the only way to be alerted on its first CVE.
-
Adjust the Alert threshold if needed, then click Add N to stack. A message confirms how many components were added, then the vulnerabilities caught up, if any (published since the project was created).
The arrow at the top left goes back to the drop area to pick another file; closing the window abandons the import.
How each component is recognised. The component’s CPE is read first, then its package URL (purl: pkg:npm/jquery@3.7.1), and failing that its name. The component is stored as a product if that product is named by a CVE, otherwise as a vendor if the vendor is known, otherwise as an unreferenced product. The file’s version is kept, as well as the vendor and CPE when known: that is what makes alerts precise.
On a project where NIS2 is turned on, importing an SBOM or a manifest is also recorded in the project’s inventory-review register (see NIS2 registers).
Detecting from a URL
Section titled “Detecting from a URL”Detect from a URL analyses a public page and offers the technologies it serves (web server, language, CMS, JavaScript libraries…). It is the fastest route when a site is live.
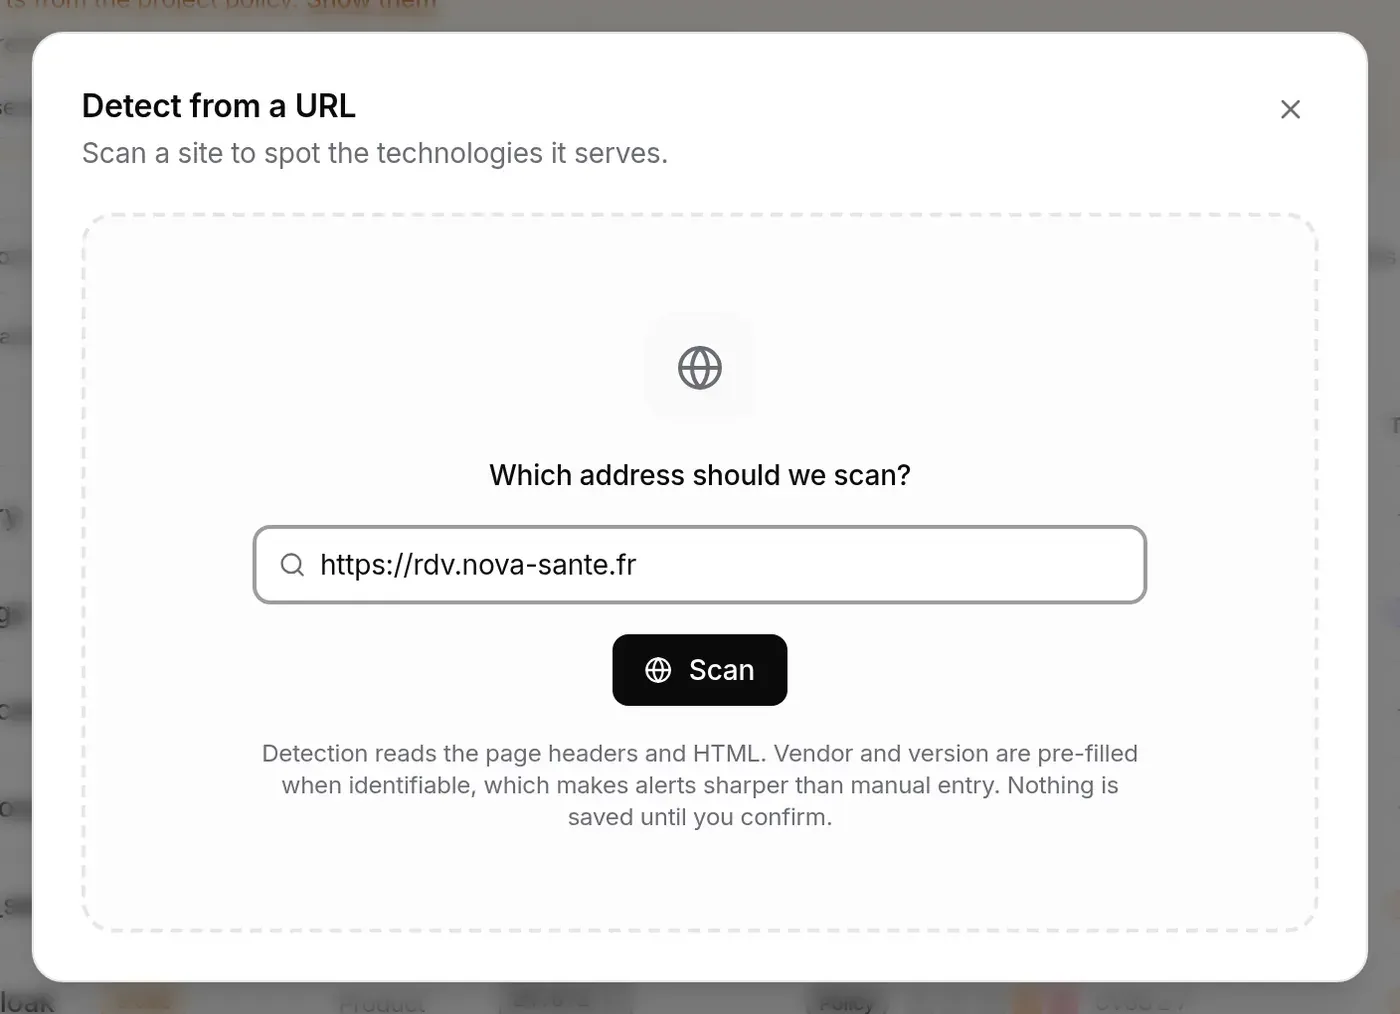
- Click Detect from a URL.
- Type the address (
https://…) and click Scan. - The review screen is the same as for a file: tick the technologies to add, set the threshold, then Add N to stack.
Detection reads the page headers and HTML. Vendor and version are pre-filled when identifiable; a technology with no CVE equivalent (an audience-measurement tool, say) appears as not referenced. Nothing is saved before you confirm: neither the URL nor the technologies.
Rules applied:
- the address must be public: internal addresses are refused;
- 10 scans at most per 5-minute window and per person (“Trop de scans d’URL — patientez quelques minutes.”, a server message shown in French);
- if the page does not answer or reveals nothing, a message says so.
Inventory connectors (GLPI and Intune)
Section titled “Inventory connectors (GLPI and Intune)”A hand-typed stack ages: a version is upgraded, some software is removed, and alerts go wrong. Connectors re-read, every night, the software actually installed, where your team already inventories it, and keep the stack up to date.
They are set up in the project settings: Workspace › Organizations, your organisation, Projects page, the project, then its Integrations page. They are included in the Pro and Business plans; on another plan the card carries a padlock and the section shows “Inventory connectors unlock with the Pro plan” and a connector already set up stays read-only.
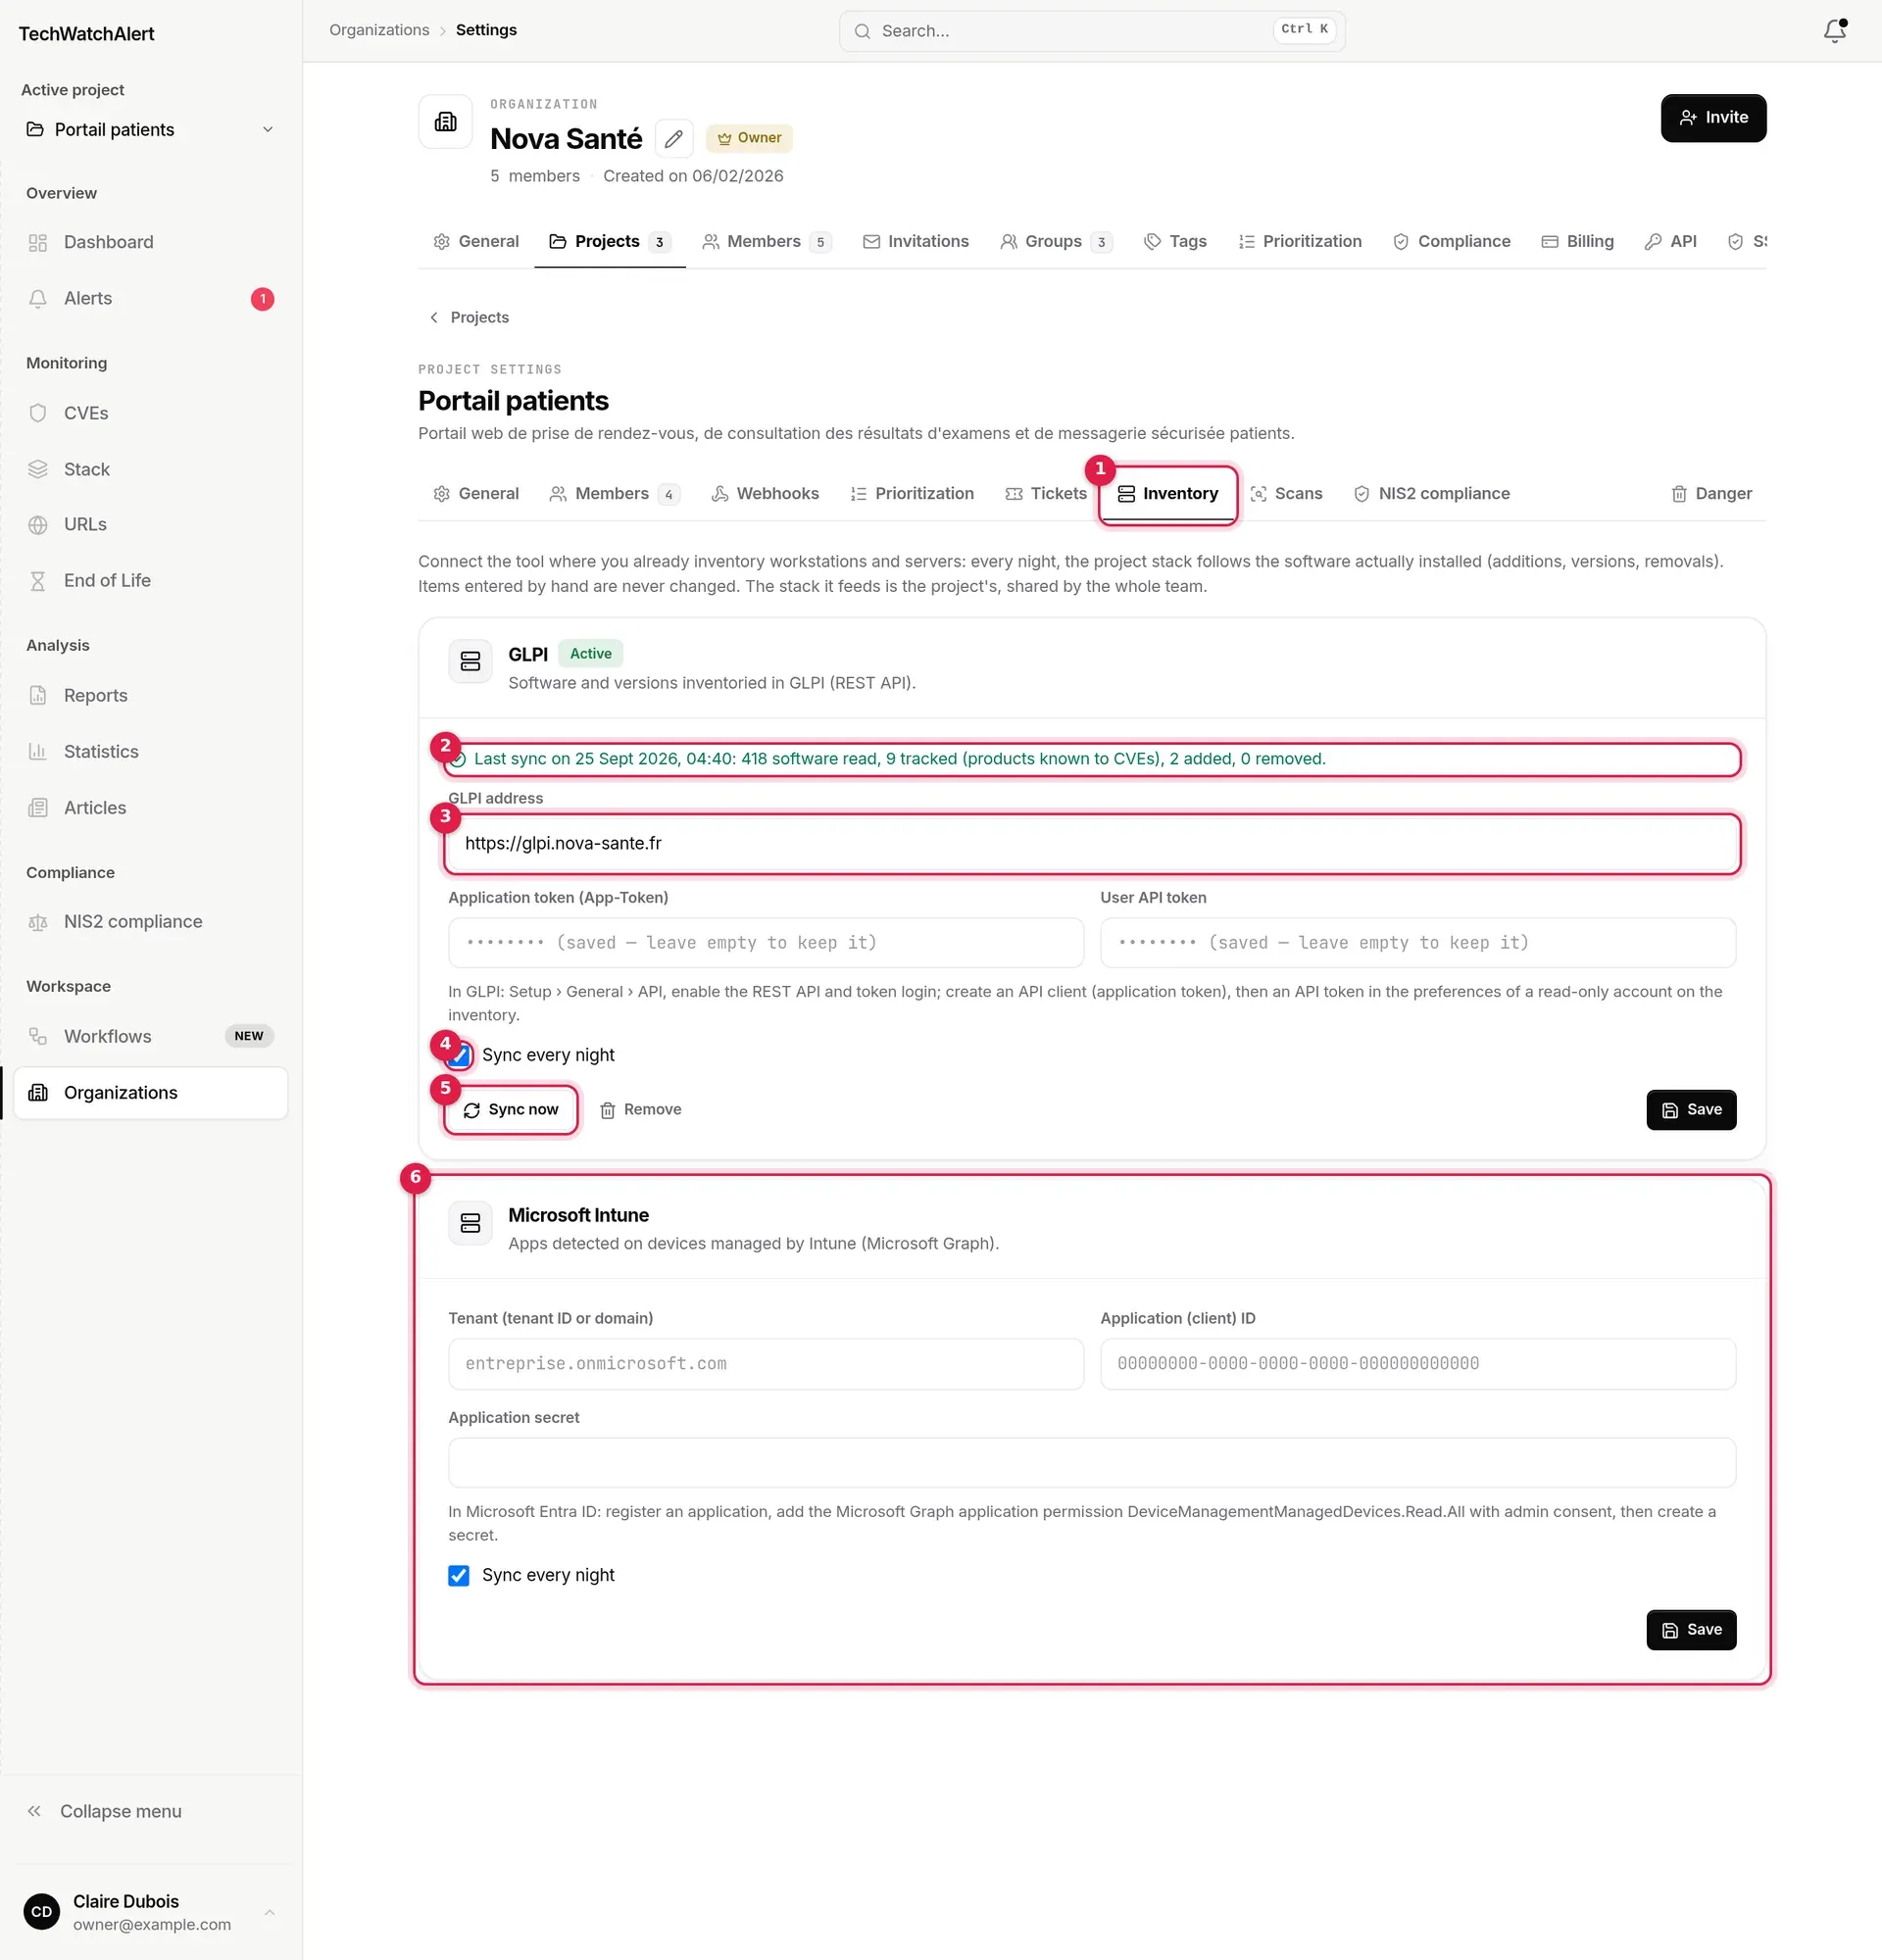
- The Inventory section of the project’s Integrations page.
- The last sync result: date, software read, software tracked (products known to CVEs), added, removed. When a sync fails, an amber banner shows instead (“Sync failed on …:” followed by the reason).
- GLPI address and, below, the two tokens.
- Sync every night: unticked, the connector is Paused.
- Sync now runs a sync straight away; Remove deletes the connector.
- The Microsoft Intune card, not configured yet.
Setting up GLPI
Section titled “Setting up GLPI”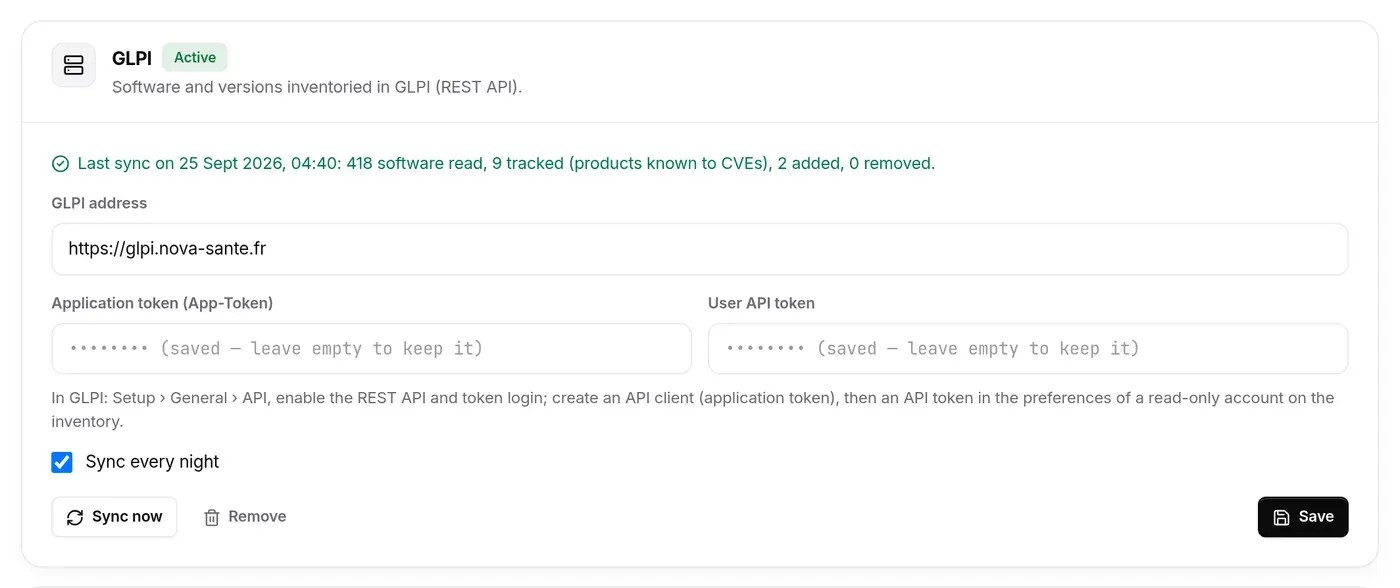
- In GLPI: Setup › General › API, enable the REST API and token login; create an API client (it gives the application token), then an API token in the preferences of a read-only account on the inventory.
- In TechWatchAlert, enter the GLPI address (it must start with
https://;/apirest.phpis appended if missing), the Application token (App-Token) and the User API token (required). - Click Save, then Sync now for a first read.
Setting up Microsoft Intune
Section titled “Setting up Microsoft Intune”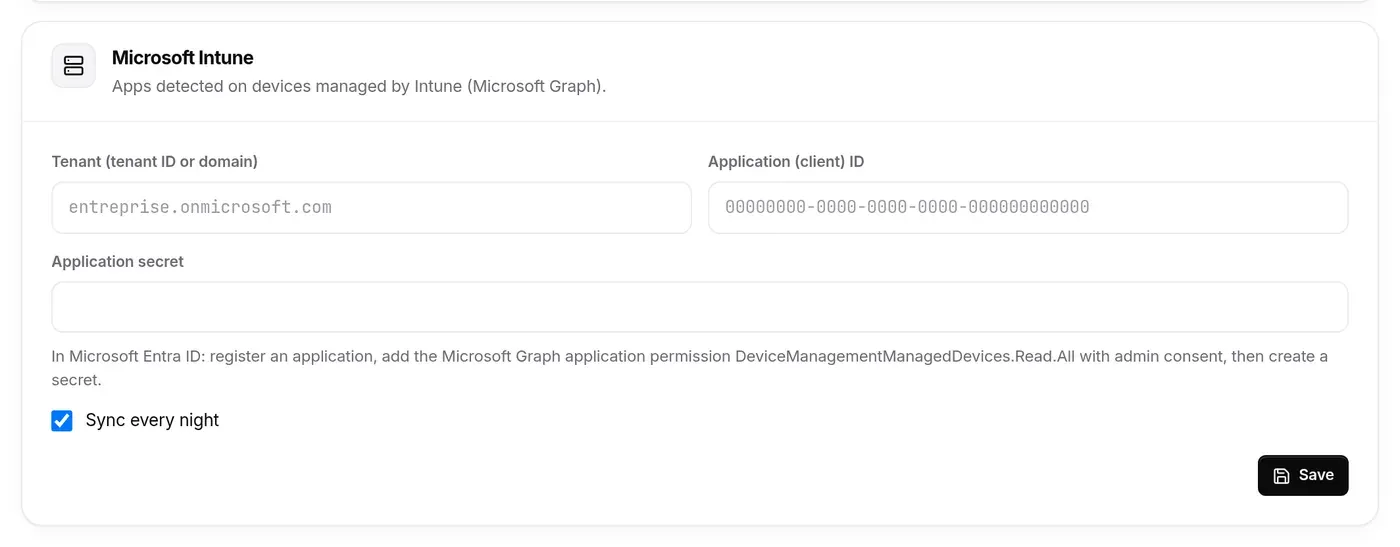
- In Microsoft Entra ID: register an application, add the Microsoft Graph application permission
DeviceManagementManagedDevices.Read.Allwith admin consent, then create a secret. - In TechWatchAlert, enter the Tenant (tenant ID or domain) (an identifier or a domain such as
company.onmicrosoft.com), the Application (client) ID and the Application secret. - Click Save, then Sync now.
Intune provides the apps detected on managed devices.
What a sync does
Section titled “What a sync does”- Each inventory name is matched to a CVE product: “Mozilla Firefox (x64 fr)” becomes
firefox, “Apache HTTP Server” becomeshttp_server, “openssh-server” becomesopenssh. Only products known to CVEs are kept: an estate holds hundreds of drivers and tools with no CVE at all. The vendor is only set when it is the only one known for that product. - New product-version pairs are added to the stack, with the GLPI or Intune badge. Vulnerabilities published since the project was created are caught up in alerts, without notification; older ones create none.
- Items that this connector had added and that have left the inventory are removed. An upgrade therefore removes the old row and adds the new one.
- Items entered by hand are never changed.
- At most 2,000 additions per sync; the plan’s item cap applies (a “stack quota reached” error is then shown).
The automatic sync runs every night for active connectors not read in the last 20 hours.
Secrets and removal
Section titled “Secrets and removal”Tokens and the secret are encrypted and never shown again: once saved, the field shows “•••••••• (saved — leave empty to keep it)”. Leave it empty to keep the value, or type a new one to replace it. The GLPI address is checked again before every call; redirects are refused.
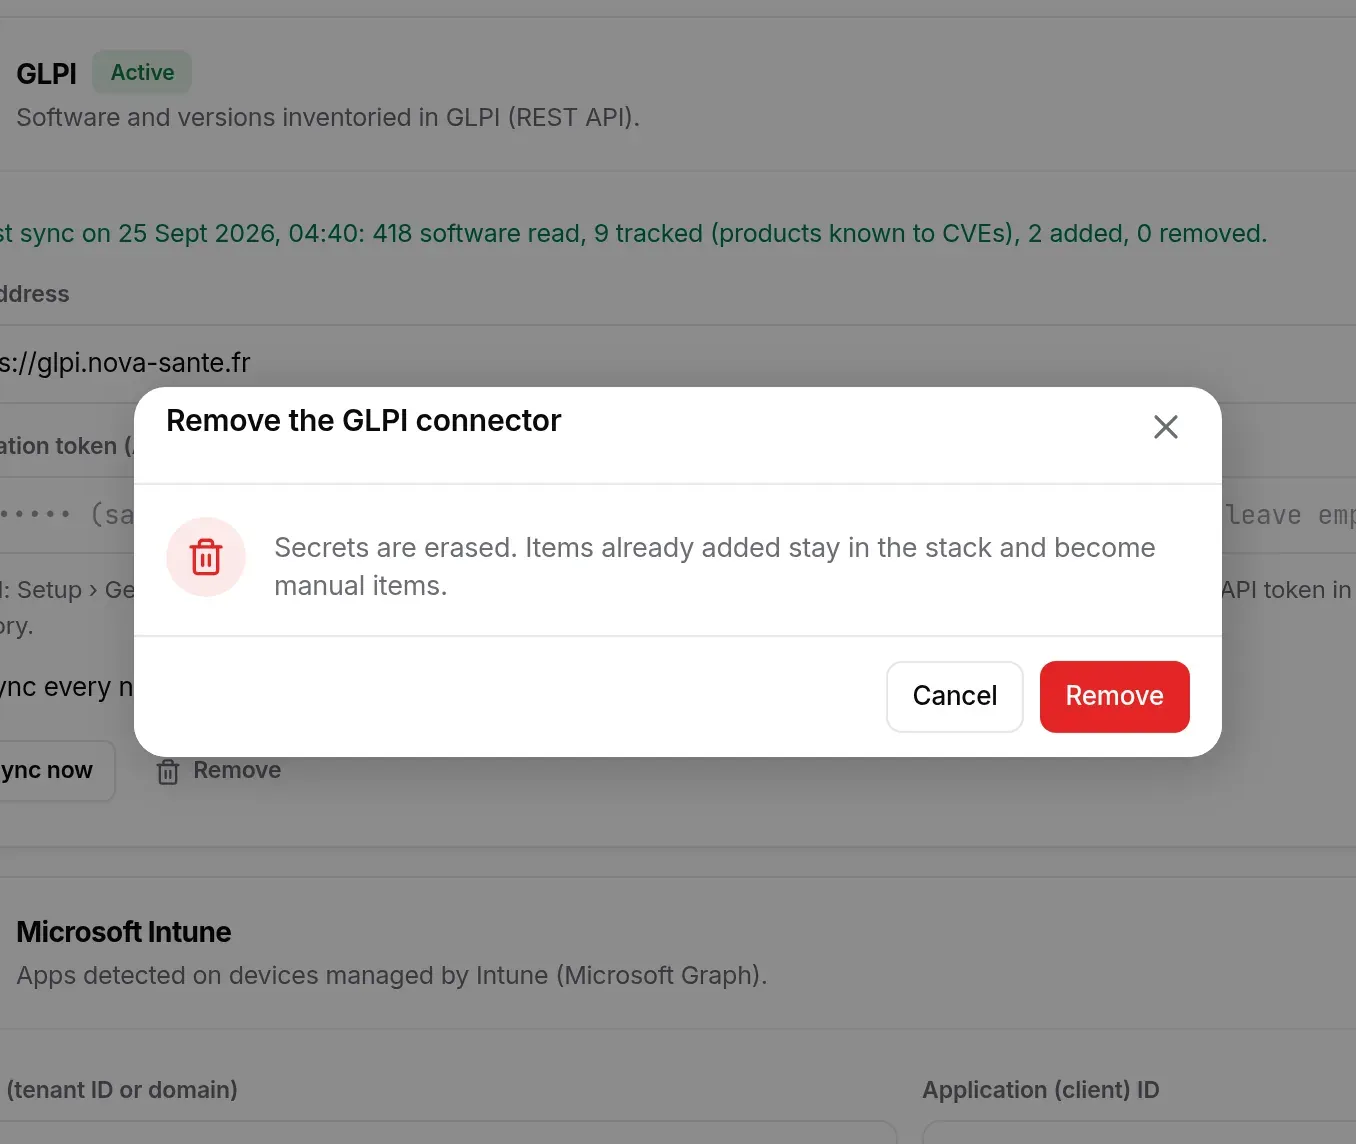
Remove erases the secrets and the connector, after confirmation. Items already added stay in the stack and become manual items.
Vulnerability scans
Section titled “Vulnerability scans”A project’s inventory is declared (stack, SBOM, detected technologies). A scan says what is actually installed. TechWatchAlert scans nothing itself: it reads the reports of the tools you already have and checks them against the project’s tracking records. It becomes the steering layer on top of your scanners.
| Tool | Format to import | What the scan brings |
|---|---|---|
| Trivy, Grype | JSON report (--format json, -o json) |
components and versions of an image or repository |
| CycloneDX with vulnerabilities (VEX/VDR) | JSON | same |
| Tenable Nessus (Nessus, Tenable.sc, Tenable Vulnerability Management) | .nessus export (XML v2), or CSV |
hosts, ports, plugins |
| Greenbone / OpenVAS | XML report (GSA: Download › XML, or GMP get_reports) |
hosts, ports, tests (OID) |
| Qualys VMDR | scan results as XML or CSV, or an Asset Data Report in XML | hosts, ports, QIDs |
| Rapid7 InsightVM / Nexpose | XML Export 2.0, or CSV | hosts, services, tests |
The format is recognised from the file’s content, not its extension: JSON, XML, then CSV as a last resort (recognised by its header row). XML is read with a parser that refuses entities and external references: a booby-trapped file (XXE, “billion laughs”) is rejected without being interpreted.
Stack › Scans
Section titled “Stack › Scans”Scans are managed in the Scans view of the Stack page (the Scans button in its header, address /stack?vue=scans), for the active project. They are stack data, not a setting: the former Scans tab of the project settings leads there, as does the Import a scan report card of the project’s Integrations page.
- The header gives the date of the latest scan, its age and the tool; Import a scan opens a file picker.
- Below, the detail of the chosen scan (the latest by default; a list picks another), with fixes not confirmed first, in red.
- At the bottom, the command for your CI to upload reports on its own (see Connecting your CI).
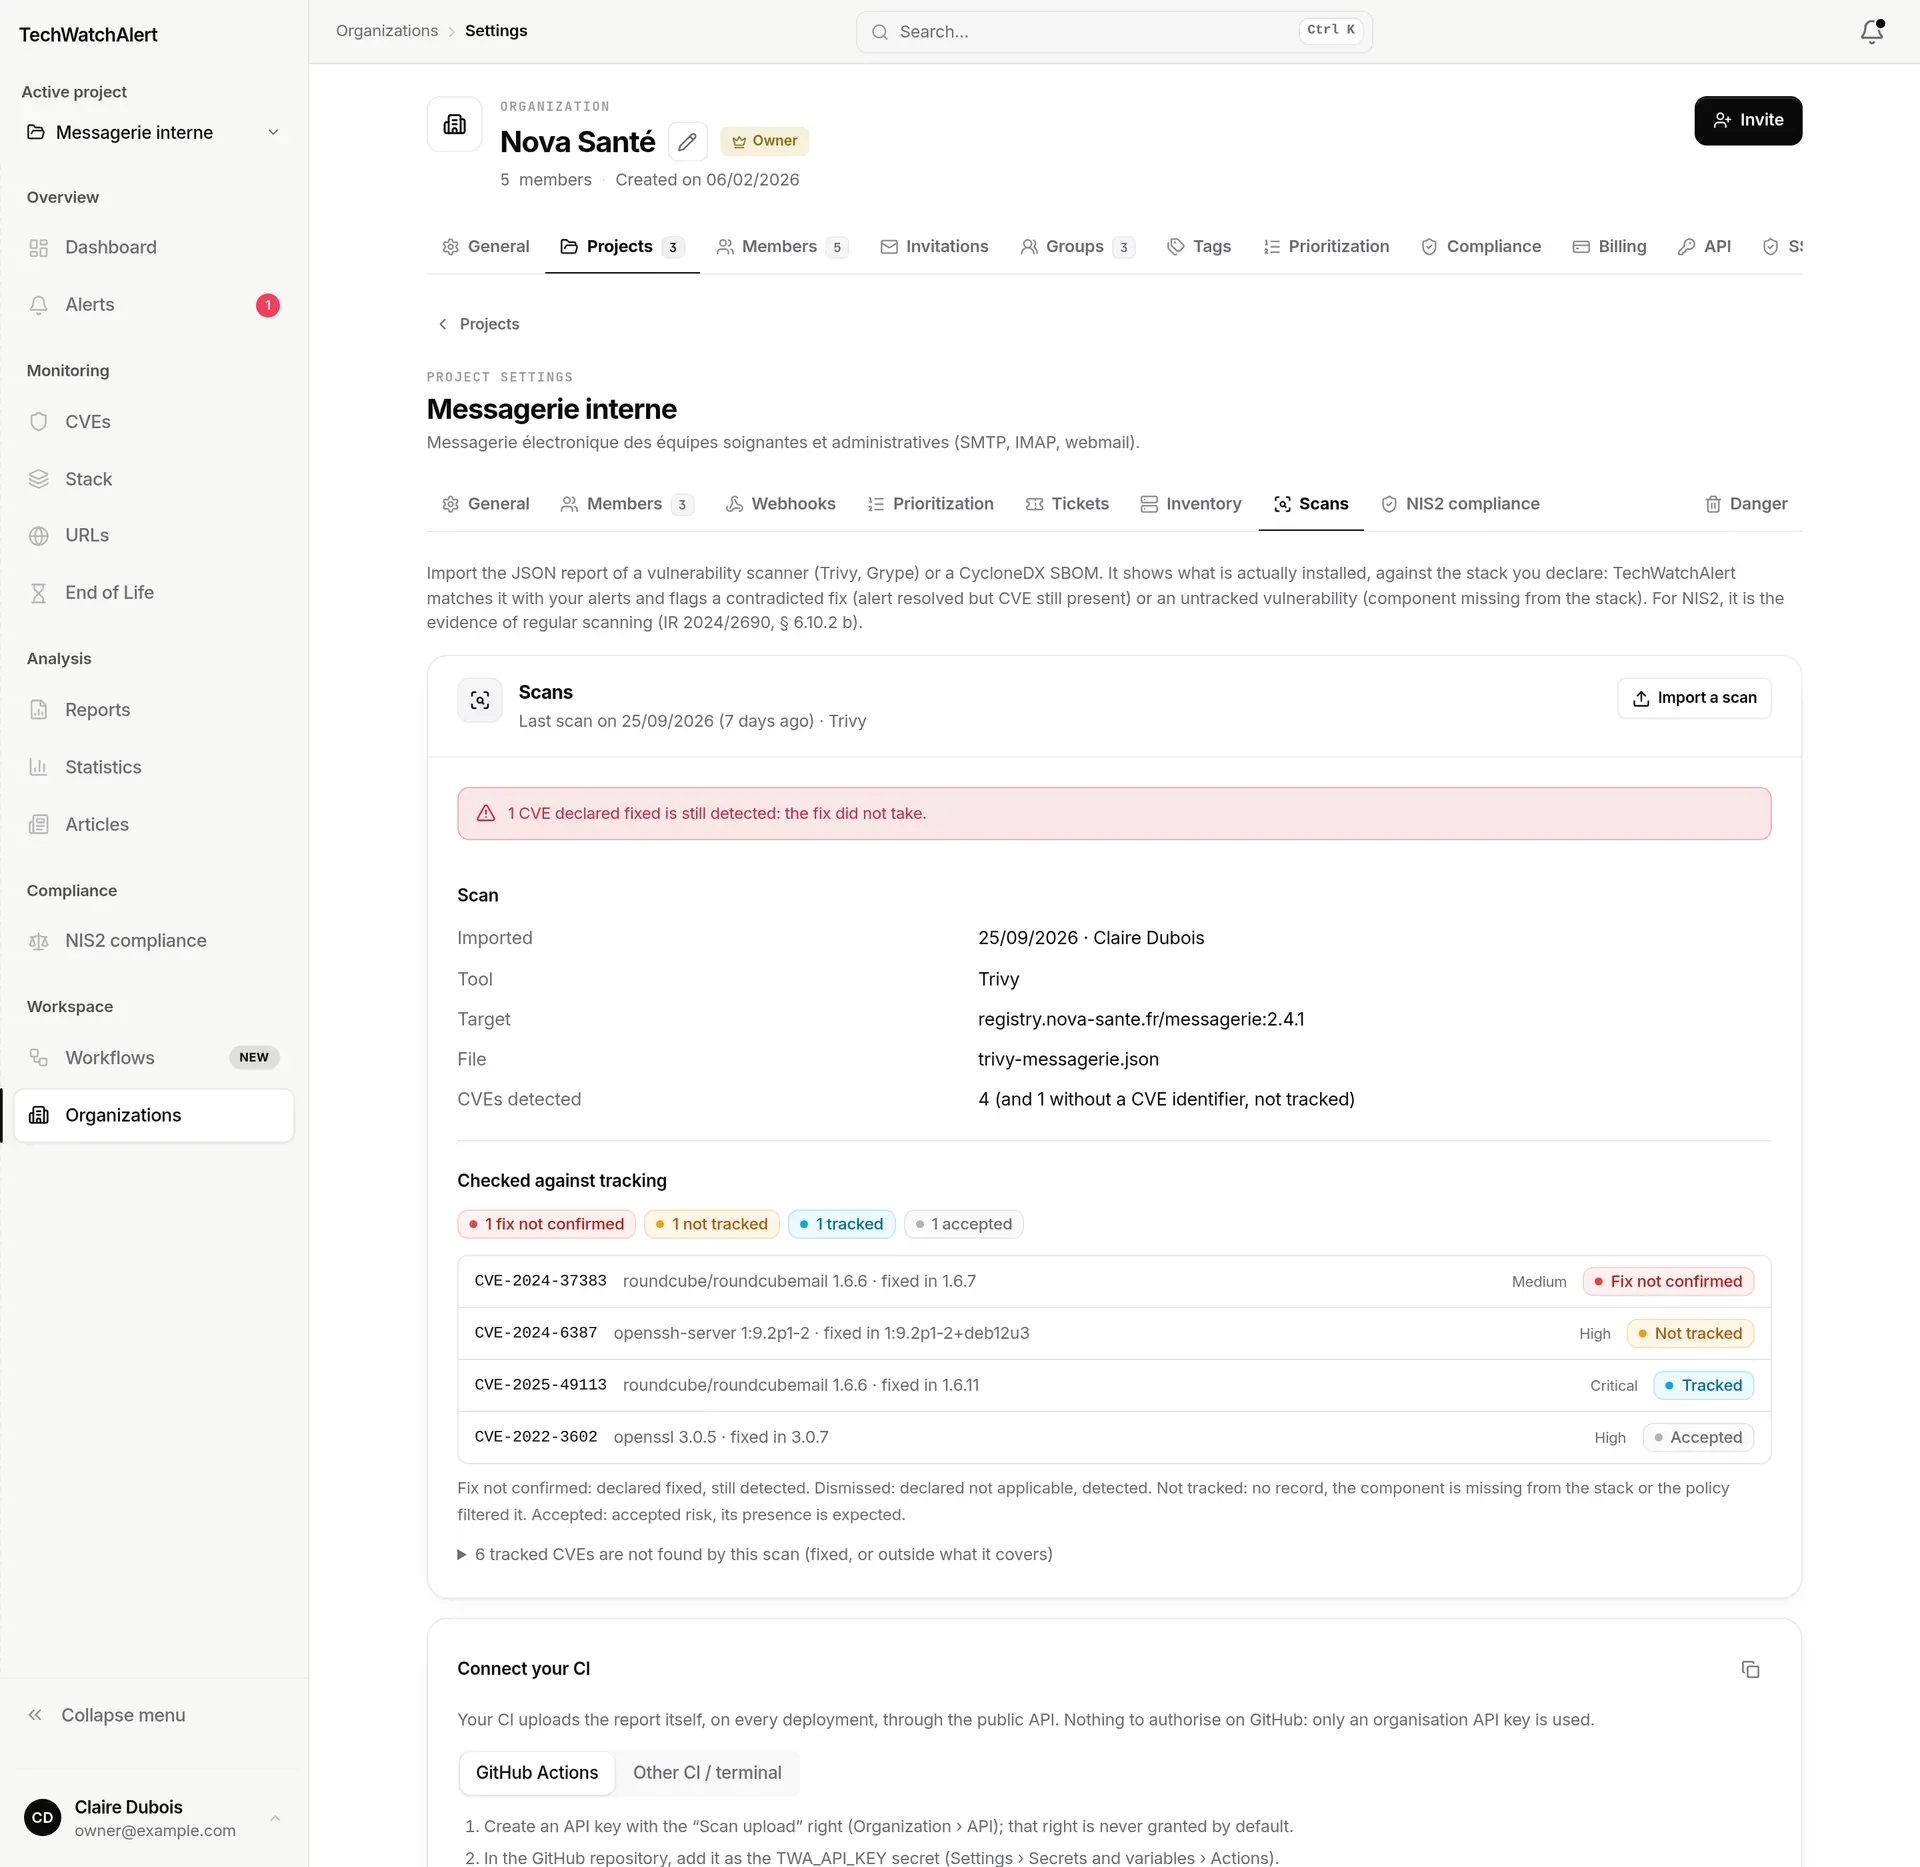
The “Import a scan” link of the NIS2 getting-started steps and the “fixes not confirmed” item of To do now lead to this view.
Importing a report
Section titled “Importing a report”- Produce the report, for example
trivy image --format json -o trivy.json <image>, or export the latest scan from your network scanner (see the table above). - Click Import a scan and choose the
.json,.xml,.nessusor.csvfile (20 MB max). - The view shows the imported scan; a message gives the number of CVEs found.
Only vulnerabilities with a CVE identifier are tracked; a GHSA vulnerability that cites its CVE is attached to it, the others are counted separately. Duplicates (same CVE, same host, same component, same version) are merged; 20,000 vulnerabilities at most per report. A CycloneDX file with no vulnerabilities is refused: it is an inventory, to be imported with Import a file.
For a network scanner:
- a finding that cites several CVEs (a Nessus plugin
Apache < 2.4.58, a Qualys QID…) gives one row per CVE; - the component is the detected product when the report gives it (CPE, service fingerprint), otherwise the test name; installed and fixed versions are kept when the scanner writes them;
- purely informational findings without a CVE (Nessus “None”, Greenbone “Log”, Qualys “Information gathered”) are ignored, as are false positives declared in Greenbone; other vulnerabilities without a CVE are counted separately;
- the same finding on two ports of one host (Apache on 443 and 8443) counts once.
Reading the check
Section titled “Reading the check”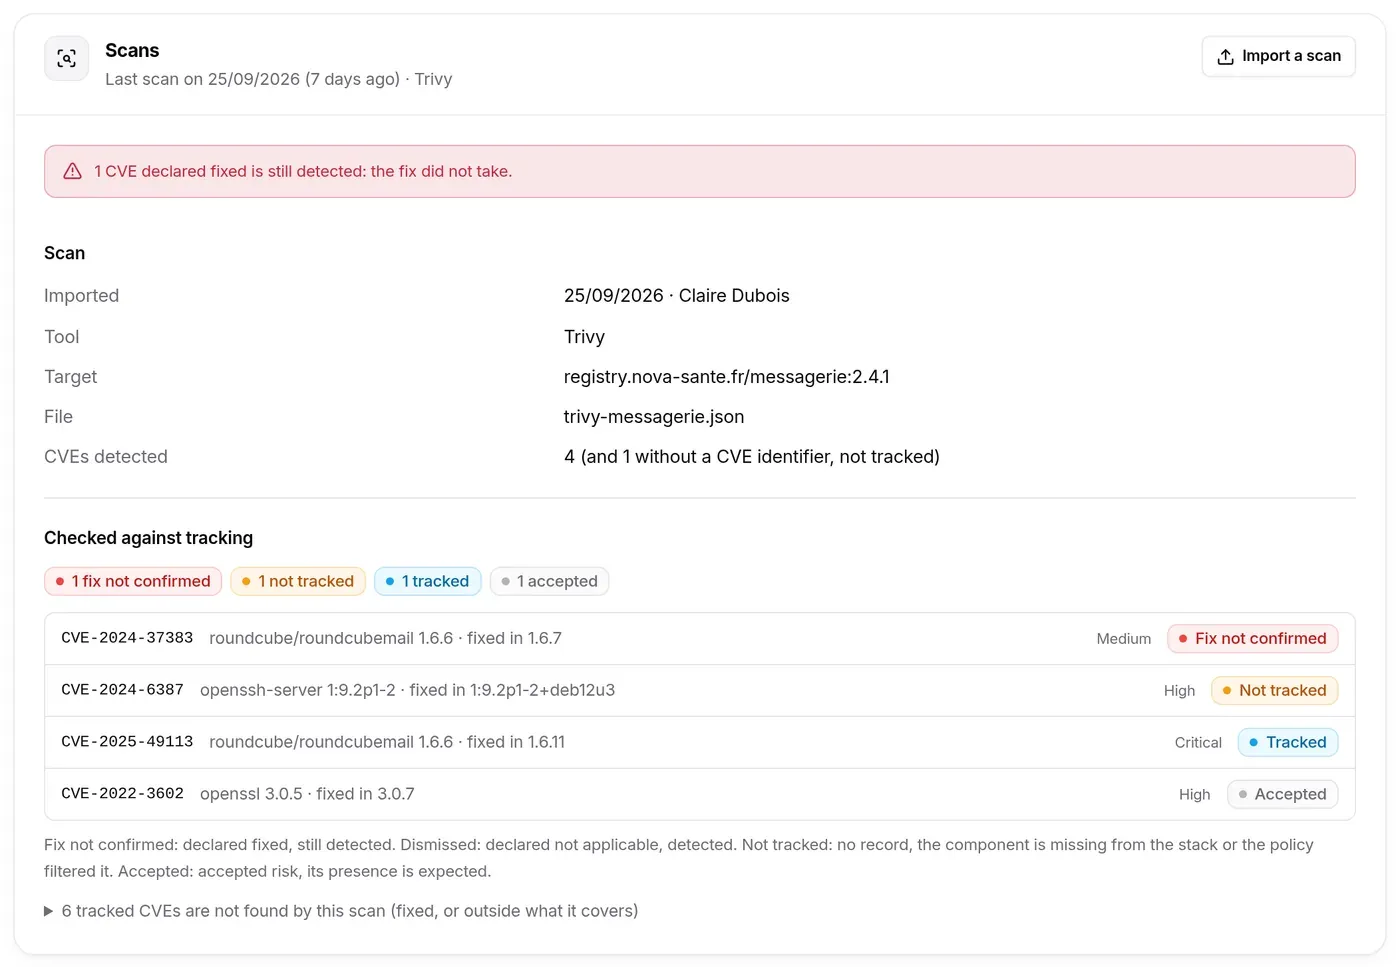
The Scan block gives the import date and who imported it (or “via the API (CI)”), the Tool (the source: Trivy, Tenable Nessus, Qualys VMDR…), the Target (image, or scan name for a network scanner), the File, the number of Hosts for a network scanner, and the number of CVEs detected. When there are several scans, a list at the top of the tab chooses the Scan shown.
For a network scanner, the By host block lists each machine (DNS or NetBIOS name, IP address, operating system, ports involved) with its number of distinct CVEs, including fixes not confirmed and untracked CVEs; hosts that disprove a fix come first, then the most exposed. Clicking a host filters the check list down to its CVEs; Show all restores the full list.
The Checked against tracking block gives, for each CVE found, its state against the project’s record. Rows are sorted by state, in this order:
| State | Meaning |
|---|---|
| Fix not confirmed | The CVE is declared fixed, but the scan still finds it: the fix did not take. |
| Dismissed | The CVE is declared not applicable, and the scan finds it. |
| Not tracked | No record: the component is missing from the stack, or the alert policy filtered it. The declared inventory has a gap. |
| Tracked | A record is open (to do, analyzing, remediating). |
| Accepted | Accepted risk: its presence is expected. |
Each row gives the CVE (link to its page), the component and its version, the fixed version when the scanner knows it (“fixed in 1.6.7”), and the severity given by the scanner; for a network scanner, the host and port (“srv-web01.example.com (10.0.0.5) · 443/tcp”). The state is the project’s record: a CVE declared fixed and found on three hosts is a fix not confirmed on all three, counted once. Below the list, a collapsible section lists the tracked CVEs this scan does not find: perhaps fixed, or outside what the scan covers.
Each project’s latest scan also feeds the NIS2 posture: projects scanned recently and fixes not confirmed (see NIS2 compliance).
Connecting your CI
Section titled “Connecting your CI”The bottom of the view gives what your CI needs to upload reports through the public API, in two ready-to-copy forms:
- GitHub Actions: a complete file to put in
.github/workflows/techwatchalert.yml. It runs Trivy (in a container, no third-party action) on the repository and uploads the report on every push tomain, every Monday and on demand. Add the API key as the repository secretTWA_API_KEY(Settings › Secrets and variables › Actions). To scan an image rather than the repository, replacefs .withimage registry/app:tag. - Other CI / terminal: the
trivythencurlcommand, to reuse in GitLab CI, Jenkins or a script.
A network scanner connects the same way: the scheduled job that exports the latest scan (Nessus, Qualys or InsightVM API, gvm-cli for Greenbone) sends the XML or CSV file with Content-Type: application/xml or text/csv.
Nothing needs authorising on GitHub: the CI pushes with an organisation API key.
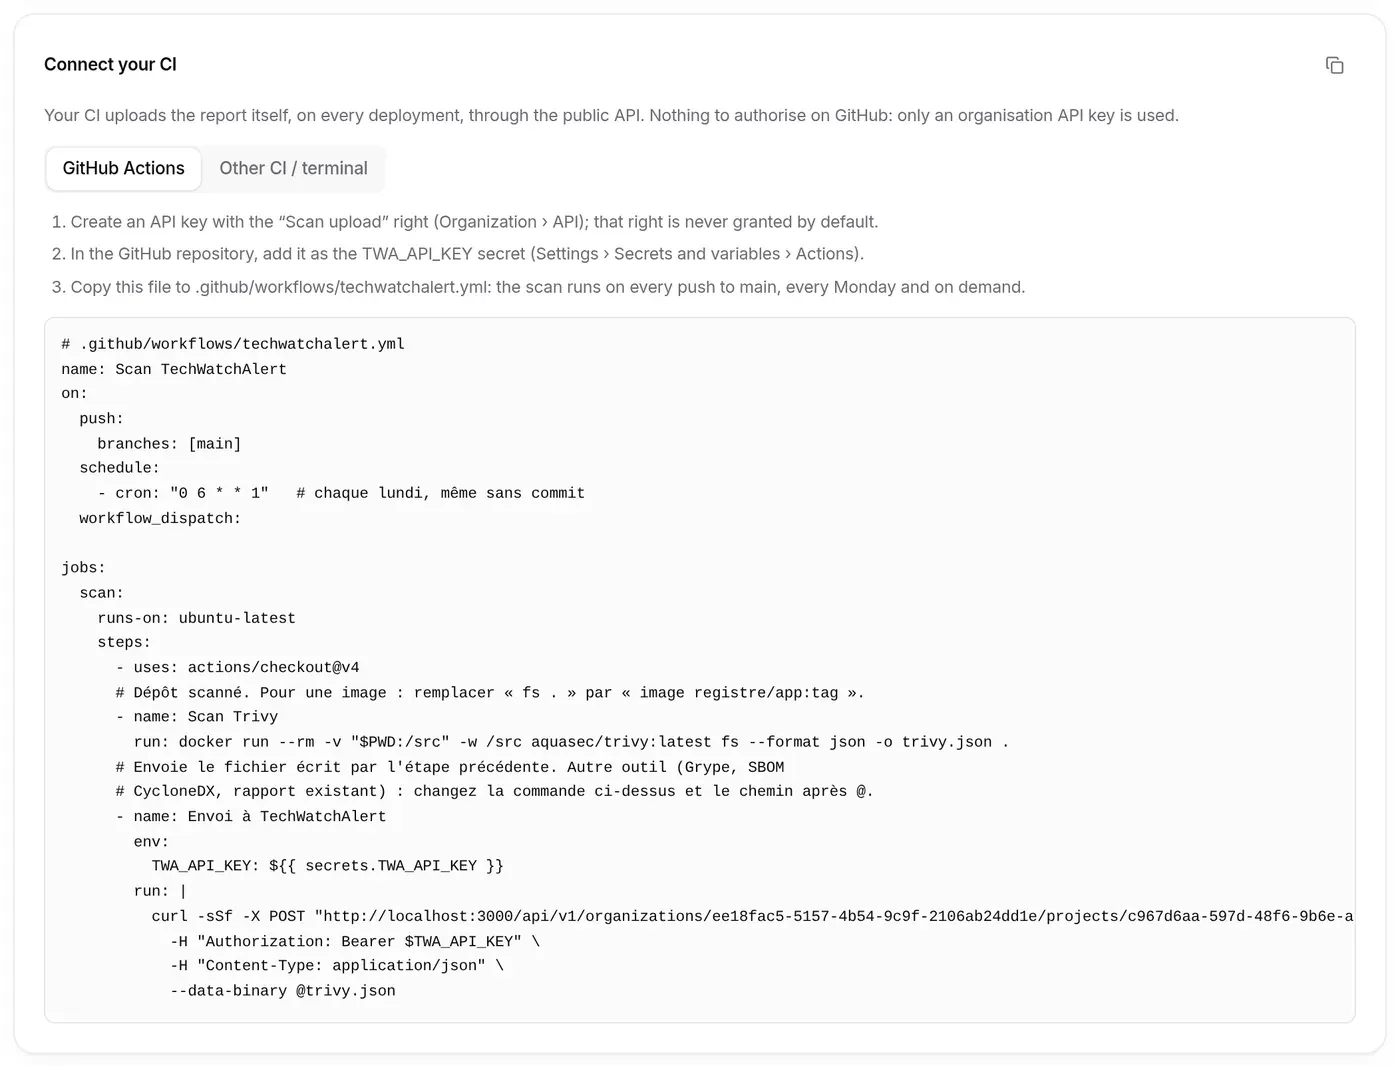
You need an organisation API key that carries the Scan upload right (Organization › API); that right is never granted by default. The request is detailed in the POST …/scans reference.
Who can do what
Section titled “Who can do what”| Action | User | Analyst | Admin | Owner |
|---|---|---|---|---|
| Import a file, detect from a URL | ✓ | ✓ | ✓ | |
| View inventory connectors | ✓ | ✓ | ✓ | ✓ |
| Configure, sync, remove a connector | ✓ | ✓ | ||
| View scans | ✓ | ✓ | ✓ | ✓ |
| Import a scan | ✓ | ✓ | ✓ |
URL detection needs the right to add to the stack; importing a file (SBOM, manifest) or a scan also needs the Import (SBOM / batch) right, granted by default to the project’s Analysts, Admins and Owner: without it, the Stack page’s Import a file button does not appear. Without configuration rights, the Inventory tab says so: “Only project administrators can configure or run a connector.”
Every addition to the stack (import, URL, connector) counts towards the plan’s item cap (see Stack).
Available depending on your plan
Section titled “Available depending on your plan”Importing network scanner reports (Nessus, Greenbone/OpenVAS, Qualys, InsightVM) has its own plan feature, included in every plan by default. Outside the plan, the Scans view says so in a banner, and dropping such a file (interface or API) is refused with a clear message and the plan that opens it. Trivy, Grype and CycloneDX reports can be imported whatever the plan. See also: Subscription › pages, views and items.
My SBOM is in SPDX format. It is not supported. Most generators (Syft, Trivy, cdxgen) can produce CycloneDX.
My network scanner covers several projects in one scan. An imported scan belongs to one project: export the report per scope (asset group, task, site) and import each into its project.
Does a scan fill the stack? No. It checks the stack against what is installed. A Not tracked CVE points precisely to a component to add to the stack.
The connector removed an item I wanted to keep. It only removes what it added itself and that has left the inventory. Add the item by hand: the connector will never touch it again.