Statistics
The Analysis › Statistics screen gives an overview of the whole vulnerability database in TechWatchAlert: how many CVEs are published, how severe they are, which are exploited, which vendors and products come up most. Use it to put your own monitoring in context, for a presentation or a trend analysis.
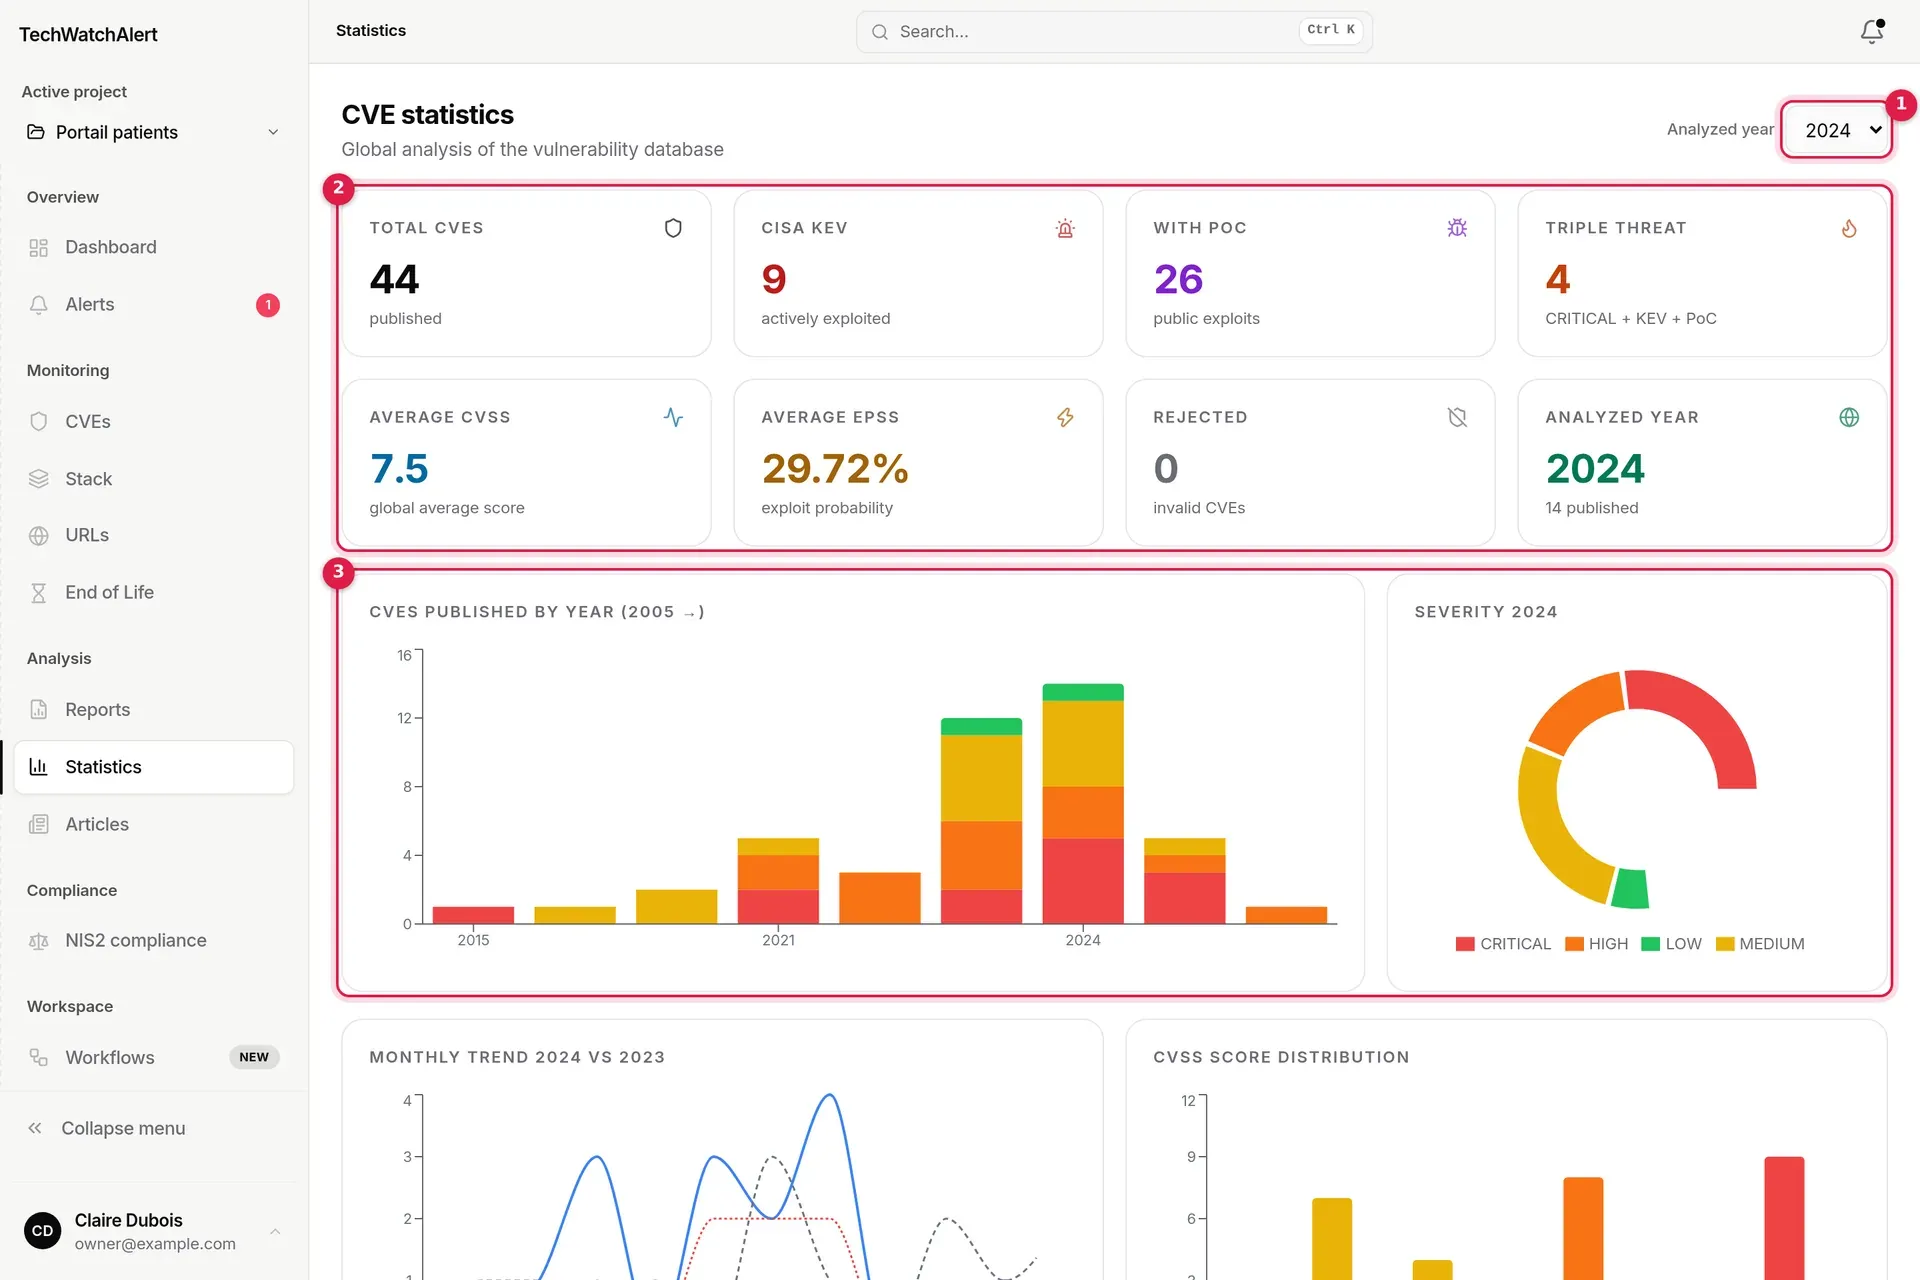
- Analyzed year: the year used by the charts that depend on it.
- The indicators for the database.
- The charts, in two or three columns, down the page.
Choosing the year
Section titled “Choosing the year”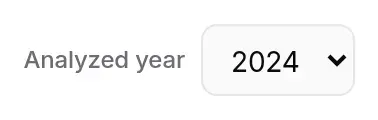
The list runs from the current year back to 2005; the current year is selected when the page opens. It changes:
- the Analyzed year indicator;
- the year’s Severity chart;
- the Monthly trend (that year and the one before);
- the year’s Top vendors and Top products.
The other charts cover the whole database. Statistics are recalculated at most every 10 minutes.
The indicators
Section titled “The indicators”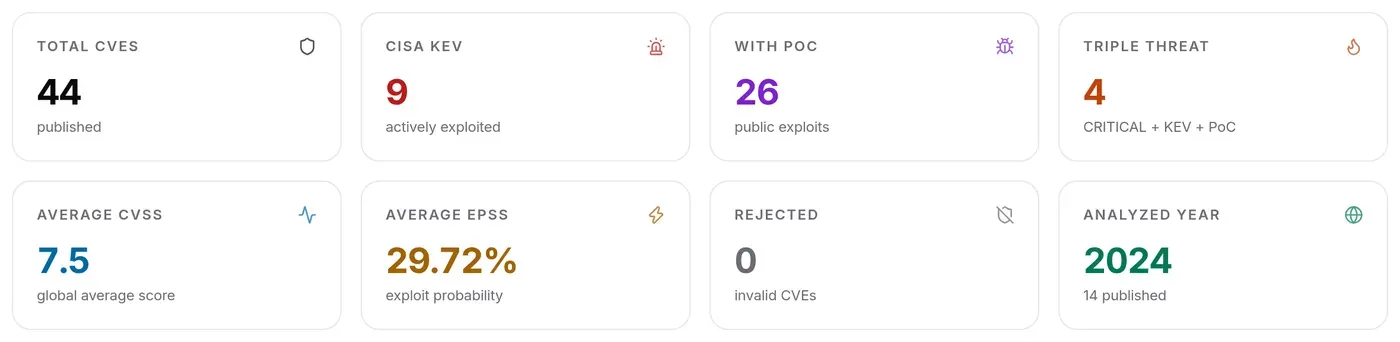
| Indicator | What it counts |
|---|---|
| Total CVEs | published CVEs (excluding rejected ones). |
| CISA KEV | CVEs in the CISA KEV catalogue, i.e. actively exploited. |
| With PoC | CVEs with a known public exploit. |
| Triple threat | CVEs that are CRITICAL, in KEV and with a PoC, all at once. |
| Average CVSS | the average of known CVSS scores. |
| Average EPSS | the average of known EPSS exploit probabilities, as a percentage. |
| Rejected | CVEs rejected by their issuing authority. |
| Analyzed year | the chosen year and the number of CVEs published that year. |
On a phone only the first four are shown; Show more reveals the rest.
The charts
Section titled “The charts”CVEs published by year
Section titled “CVEs published by year”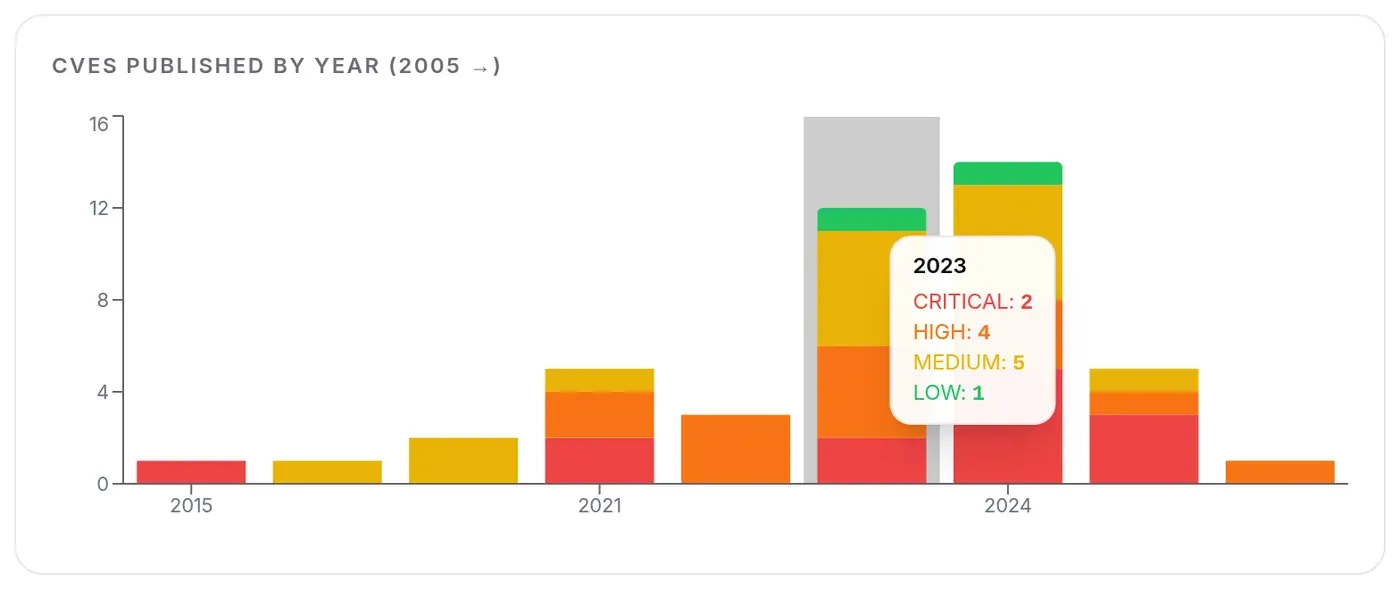
The number of CVEs published each year since 2005, as bars stacked by severity (CRITICAL in red, HIGH in orange, MEDIUM in yellow, LOW in green). Hover over a bar (tap it on a phone) to read the details.
Severity for the year
Section titled “Severity for the year”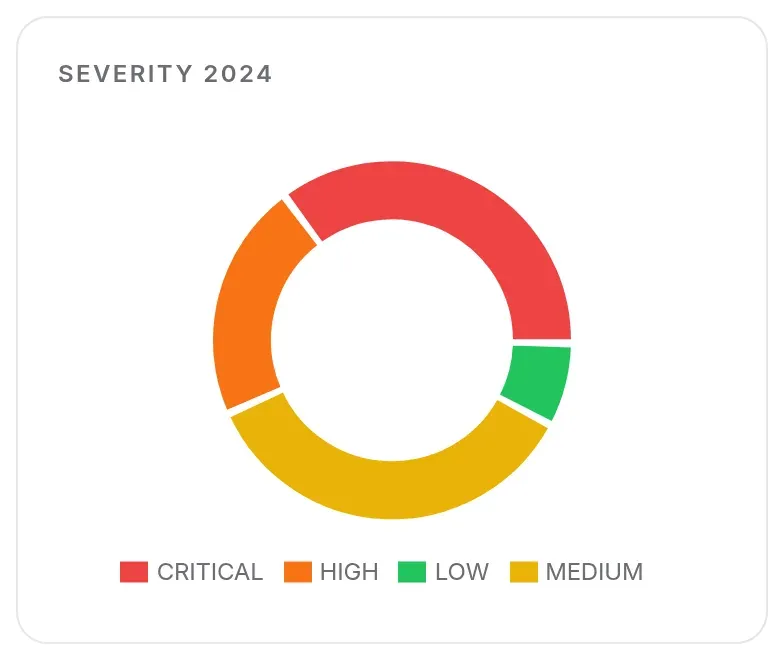
The share of each severity among CVEs published in the chosen year. If no CVE was published that year, the chart shows the breakdown for the whole database.
Monthly trend
Section titled “Monthly trend”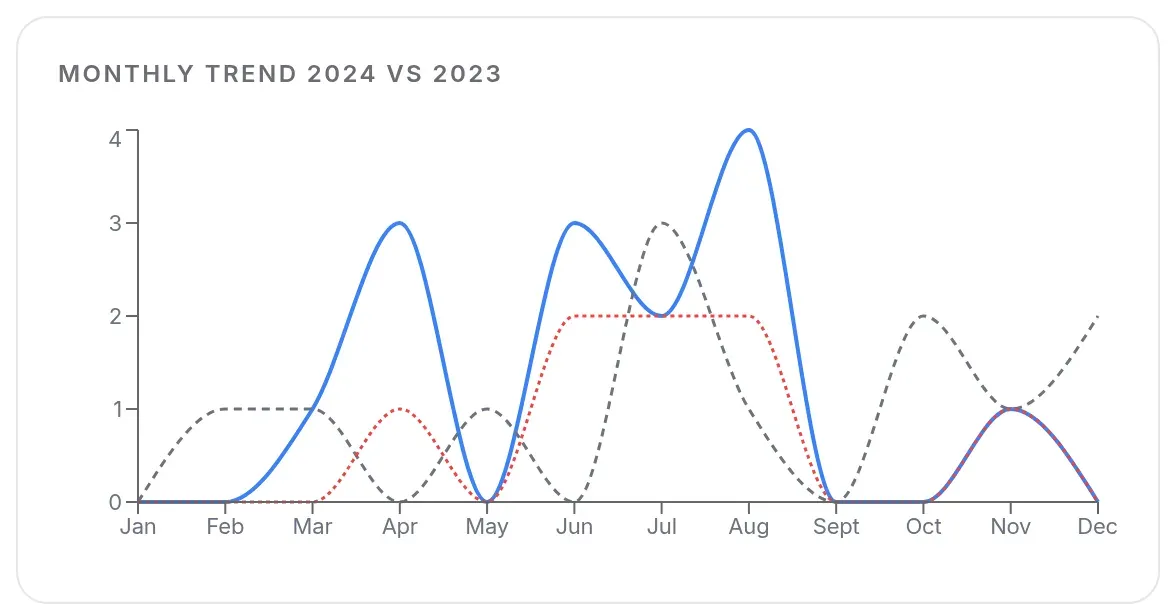
Three lines, month by month: the chosen year (solid blue), the previous year (grey dashes), and CRITICAL or HIGH CVEs of the chosen year (red dots, “HIGH+”). Hover over a month to read the values.
CVSS score distribution
Section titled “CVSS score distribution”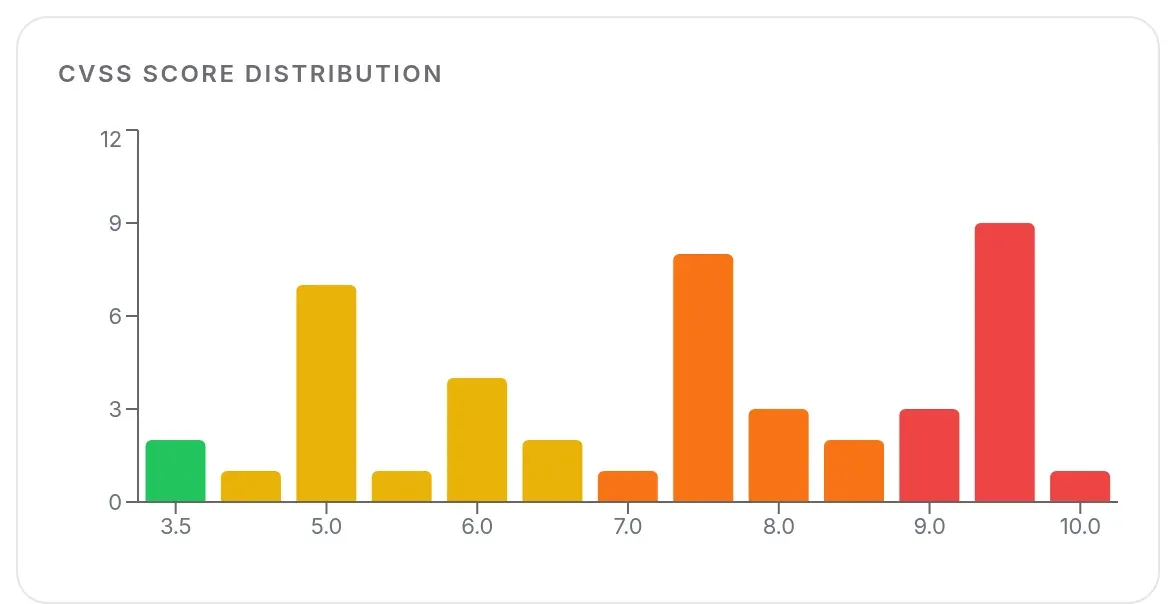
The number of CVEs per 0.5-point CVSS band, across the whole database. The colour follows the matching severity: from 9 critical, from 7 high, from 4 medium, below that low.
CRITICAL and HIGH % evolution
Section titled “CRITICAL and HIGH % evolution”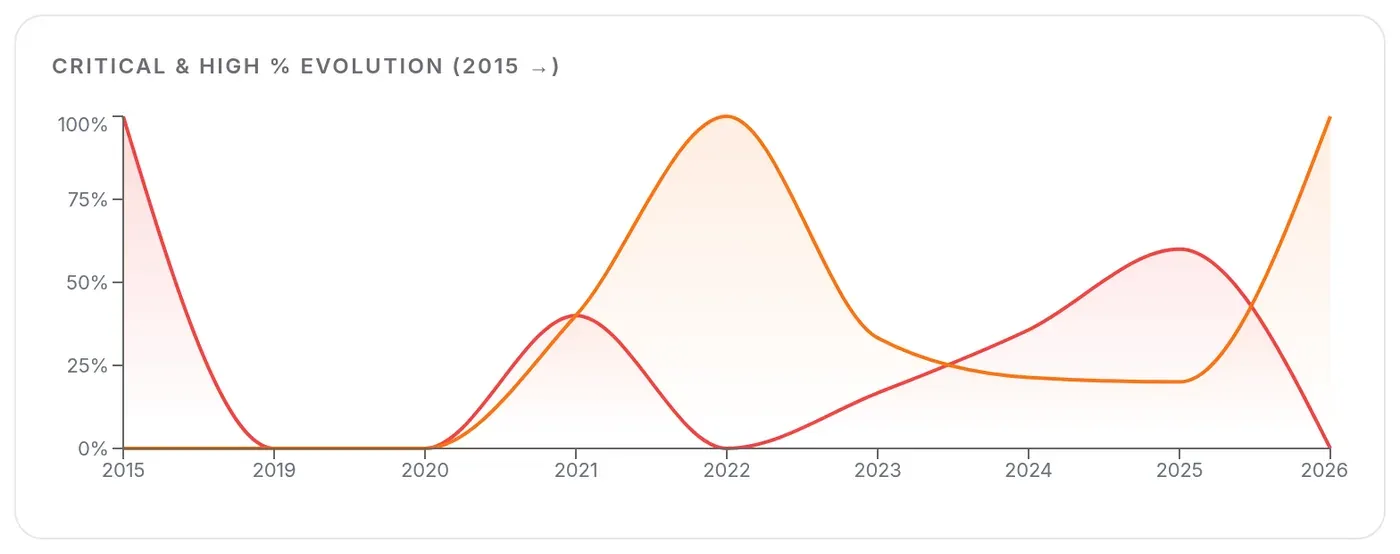
The share of CRITICAL (red) and HIGH (orange) CVEs among those published each year since 2015.
Attack vector
Section titled “Attack vector”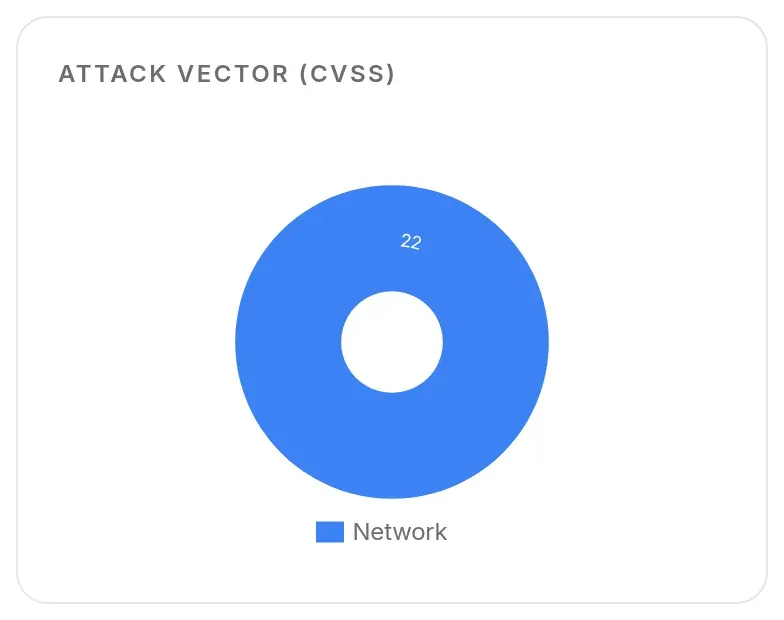
Where the flaw can be exploited from, according to the CVSS vector: Network (remotely, over the network), Adjacent (local network), Local, Physical (physical access), Unknown when the vector does not say.
Top vendors and top products
Section titled “Top vendors and top products”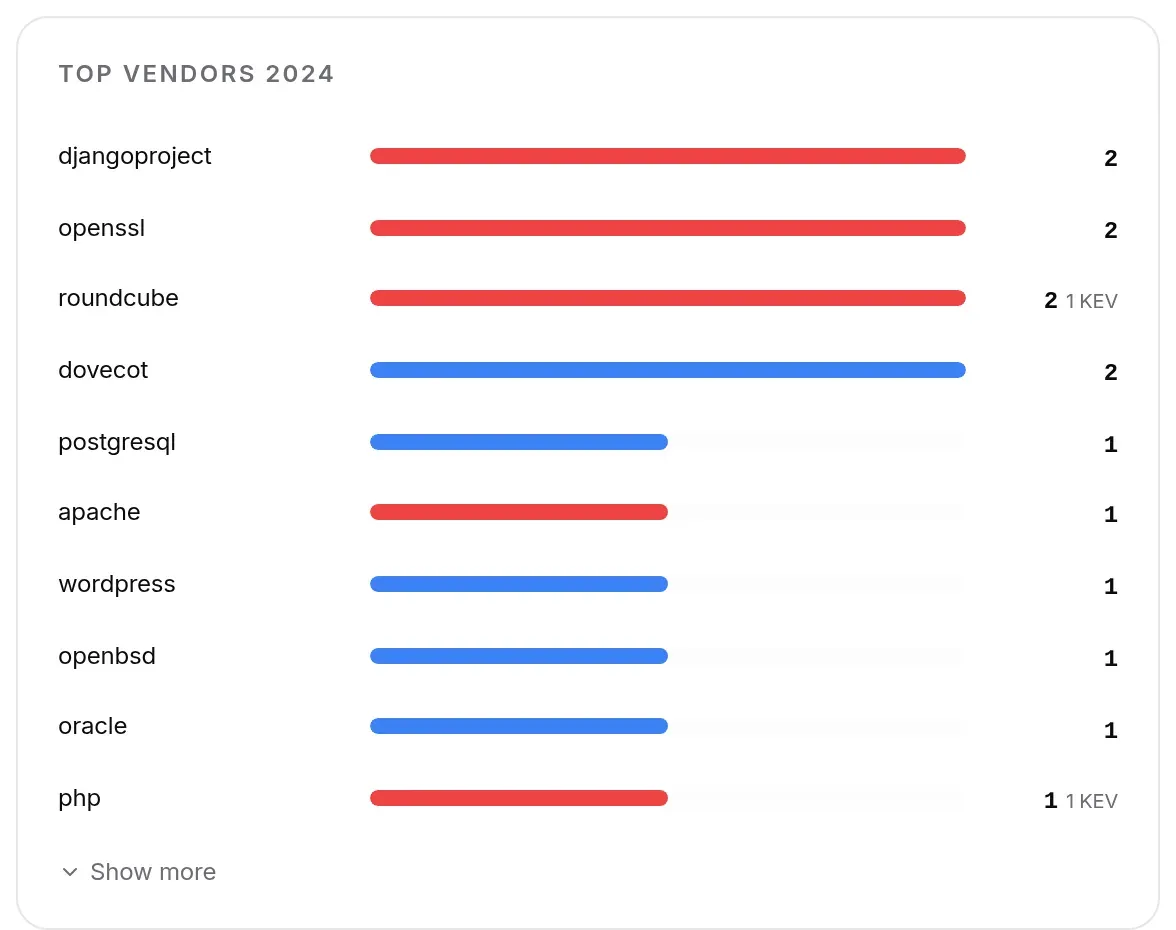
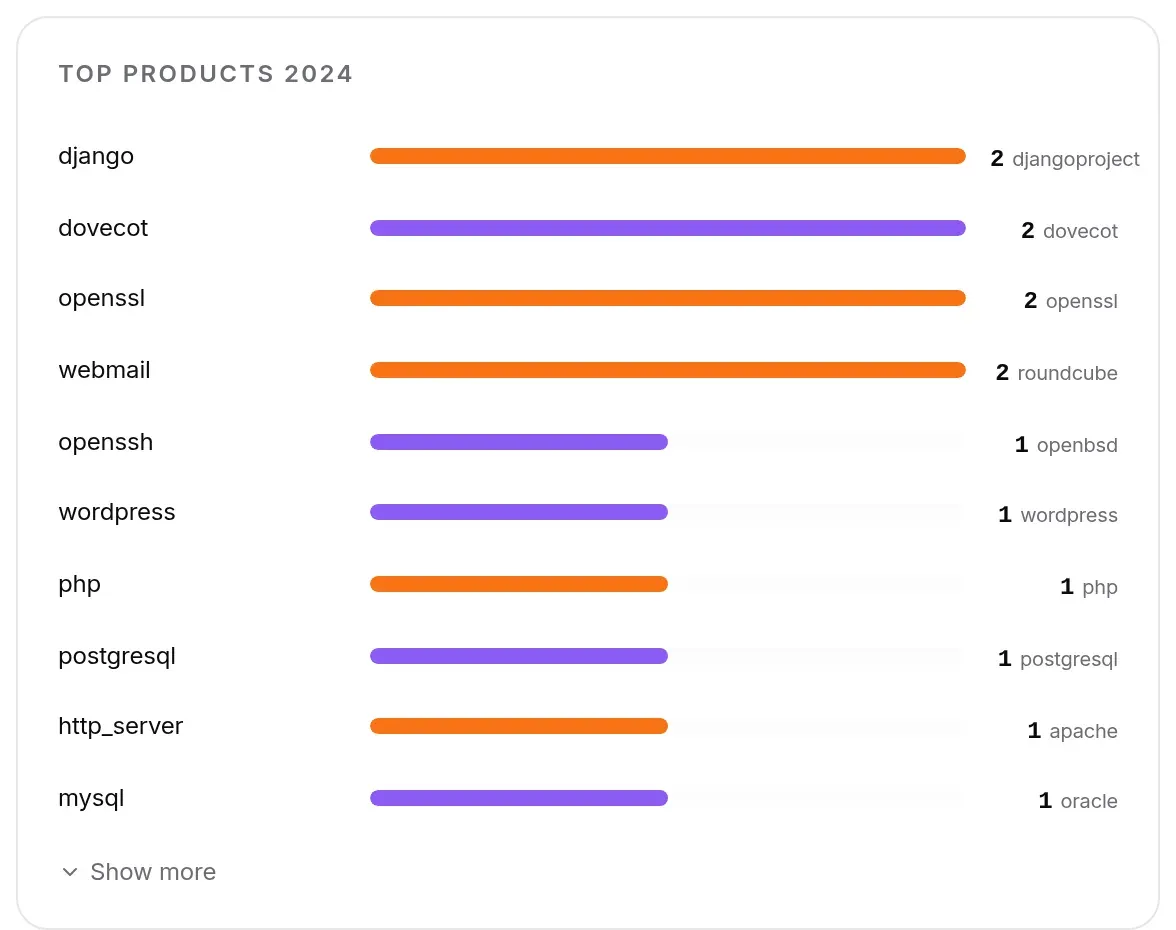
The vendors and products with the most CVEs published in the chosen year (15 at most).
- Top vendors: the bar is red if the vendor has at least one critical CVE; “N KEV” shows how many of its CVEs are in the KEV catalogue.
- Top products: the vendor is shown next to the count; the bar is orange if the product has at least one critical CVE.
- 10 rows are shown; Show more displays up to 15, Show less goes back to 10.
Top 15 weaknesses (CWE)
Section titled “Top 15 weaknesses (CWE)”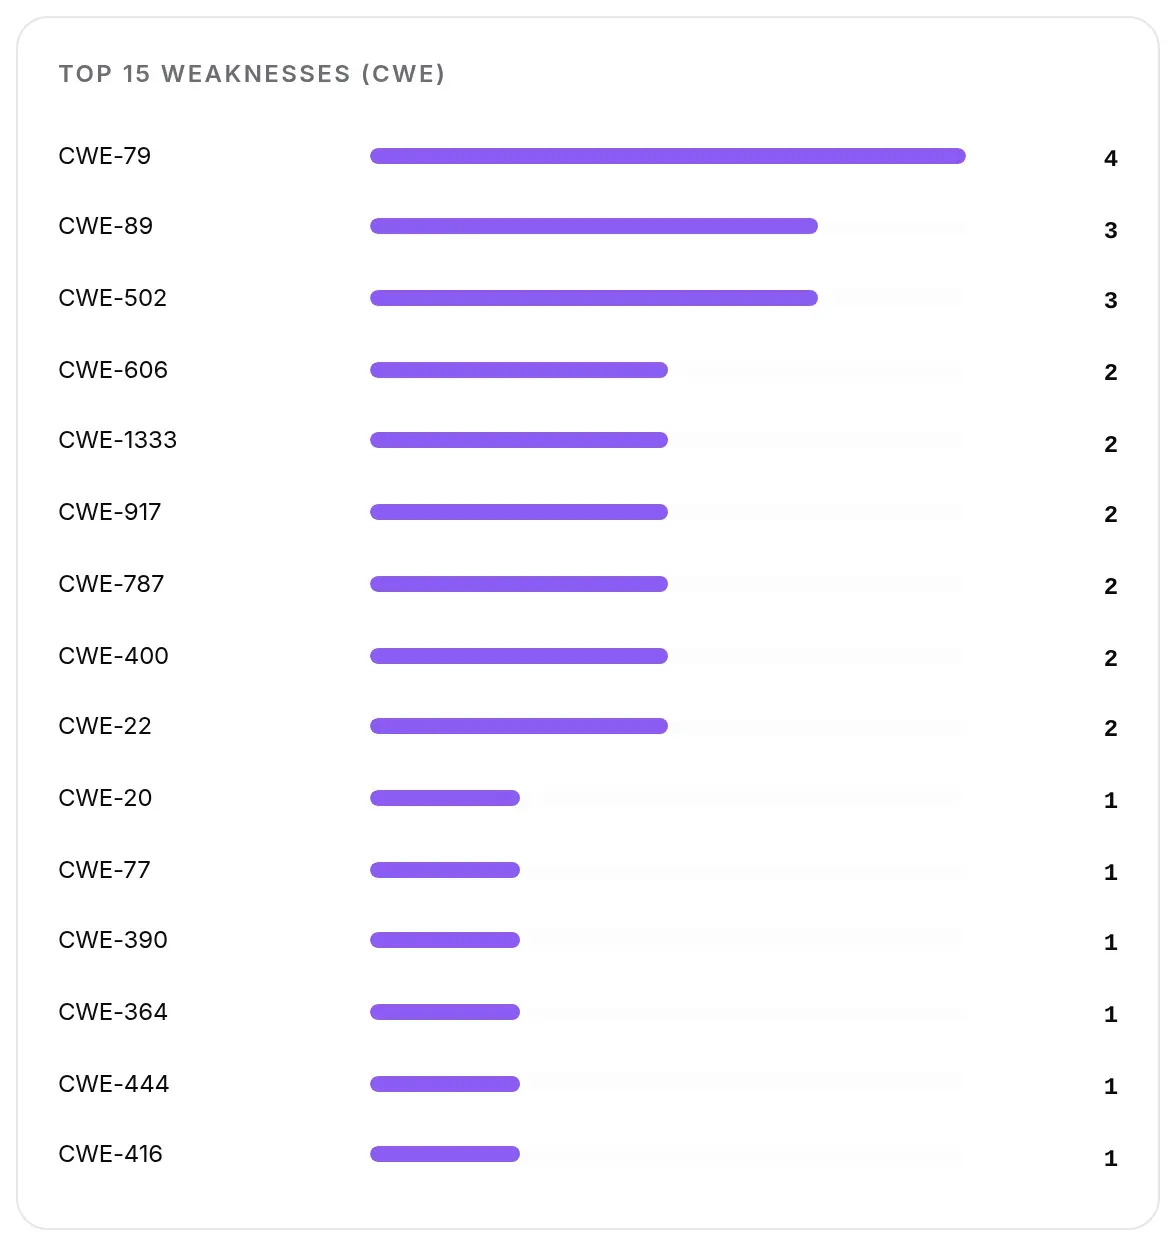
The 15 most frequent weakness types (CWE) across the whole database, for example CWE-79 (script injection into a web page).
PoC coverage by severity
Section titled “PoC coverage by severity”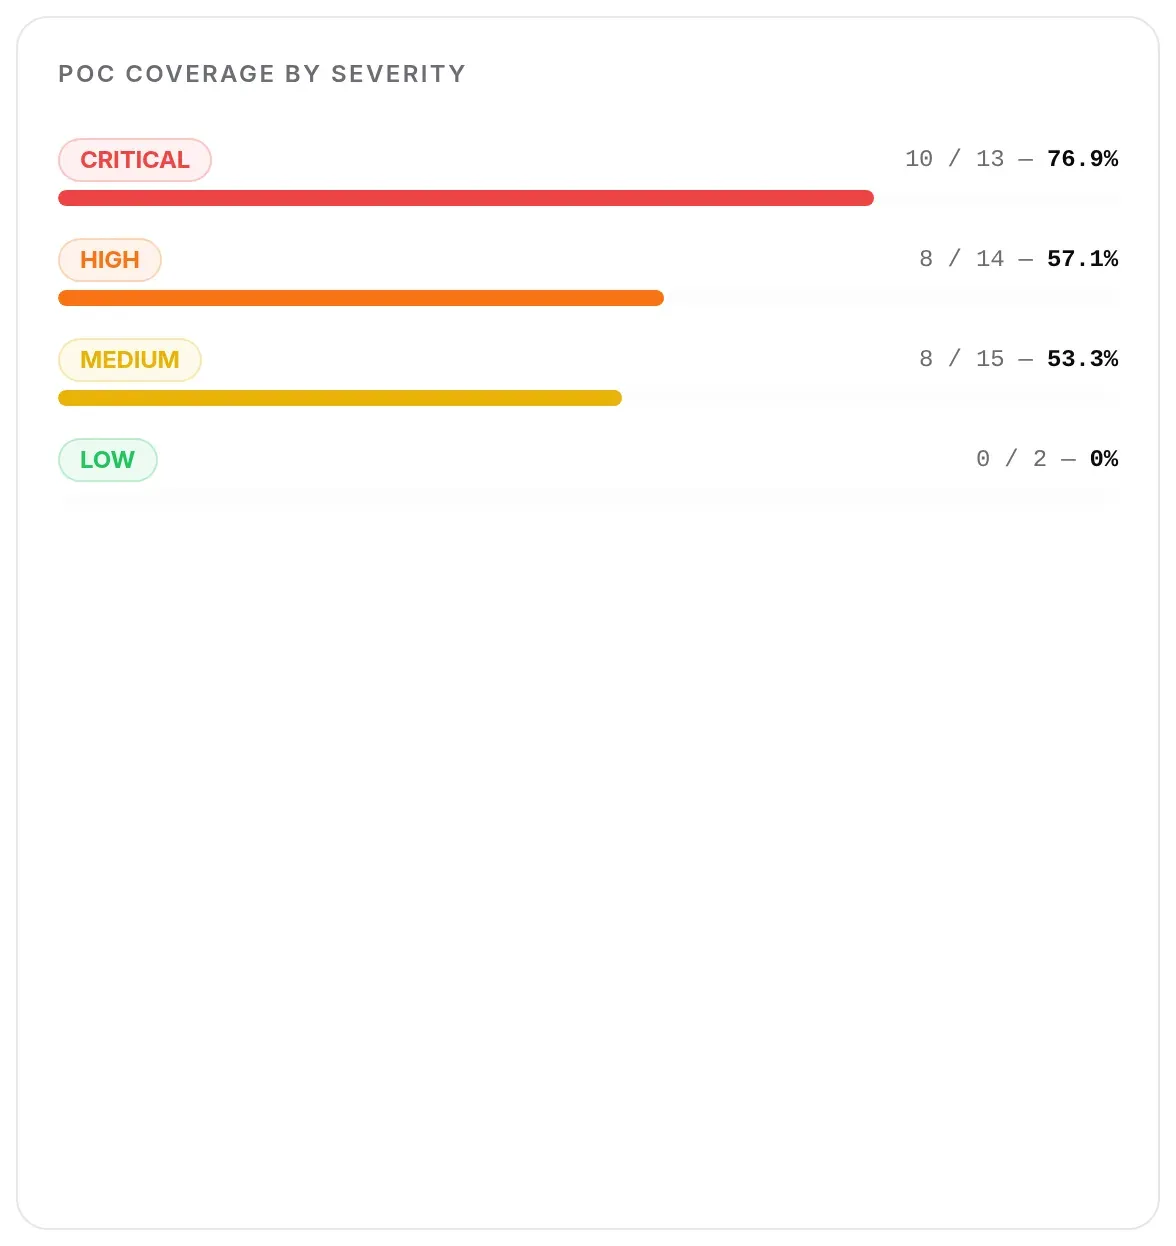
For each severity (CRITICAL, HIGH, MEDIUM, LOW), the number of CVEs with a public exploit out of the total, and the percentage.
KEVs added per month
Section titled “KEVs added per month”
The number of CVEs added to the CISA KEV catalogue each month over the last 18 months. The axis and the tooltip only show the month number (“04” for April): over 18 months the same number can stand for two different years, so read the bars from left (oldest) to right (most recent).
EPSS distribution
Section titled “EPSS distribution”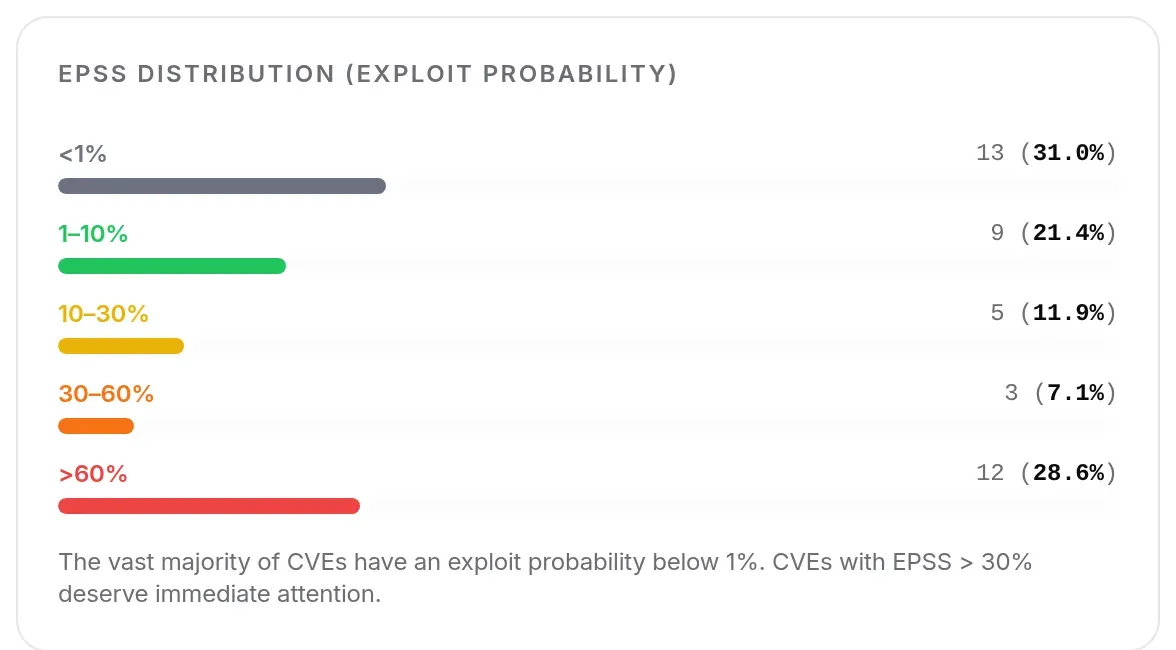
CVEs that have an EPSS score, split into five exploit-probability bands: under 1%, 1–10%, 10–30%, 30–60%, over 60%. The vast majority of CVEs sit below 1%; those above 30% deserve immediate attention.
Sources
Section titled “Sources”The data comes from TechWatchAlert’s local CVE database, fed by the NVD, the CISA KEV catalogue, FIRST.org EPSS scores and the public PoCs and exploits listed by nomi-sec/PoC-in-GitHub, Exploit-DB, Metasploit and Nuclei (noted at the bottom of the page).
Who can see this screen
Section titled “Who can see this screen”Any member allowed to view CVEs, which by default means every role. The screen does not depend on the plan.